How to Create a Streamgraph in Python
How to Create a Streamgraph in Python | Easy Data Visualization Tutorial
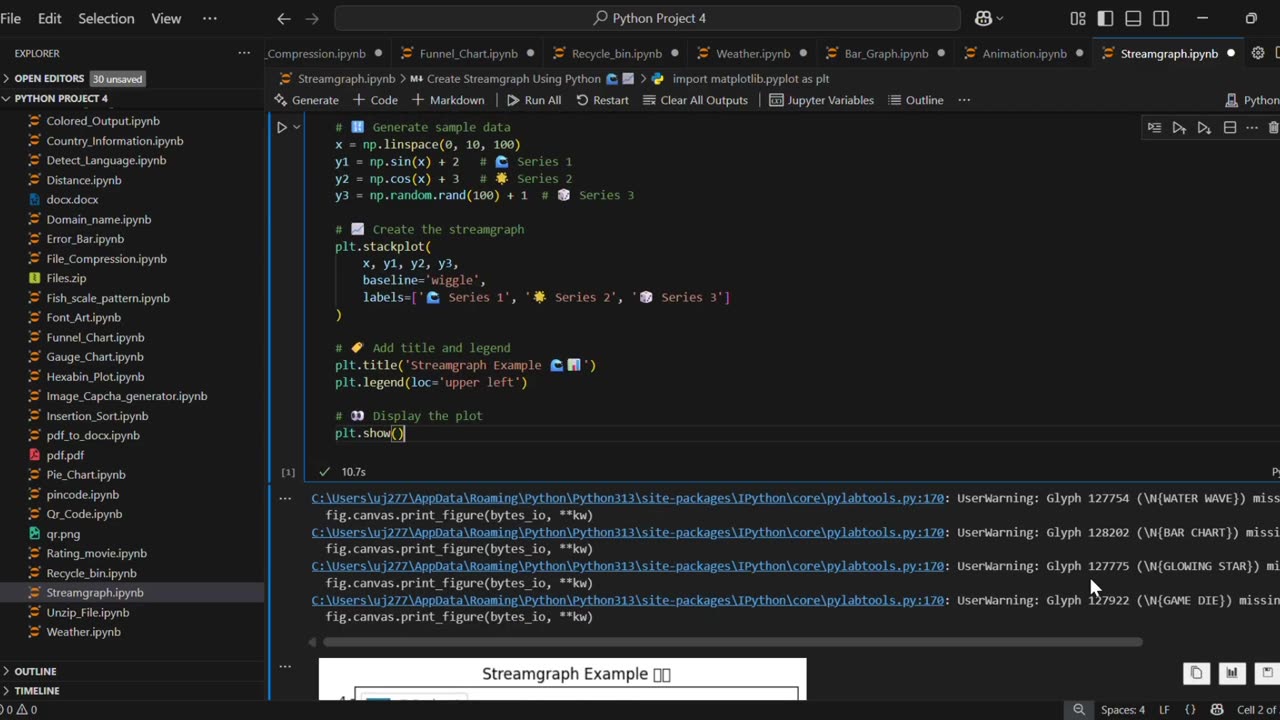
In this video, you’ll learn how to create a Streamgraph using Python and Matplotlib. A streamgraph is a type of stacked area chart with a smooth, flowing baseline, making it visually appealing for data visualization.
✅ What you’ll learn:
How to generate sample data in Python
How to plot a Streamgraph using matplotlib.stackplot()
Customize titles, labels, and legends for better visuals
This tutorial is beginner-friendly and perfect for anyone learning Python data visualization. 🚀
#Python #Matplotlib #DataVisualization #PythonProjects #Streamgraph #PythonForBeginners #PythonTutorial #LearnPython #PythonMatplotlib #PythonCharts
🔔 Subscribe for more Python, Data Science, and Data Visualization tutorials!
-
 0:19
0:19
AI Evolutionary Technology
12 days agoCreate Turtle Graphics Using Python
81 -

The White House
4 hours agoFirst Lady Melania Trump Hosts a Meeting of the White House Task Force on AI Education
1.44K8 -
 LIVE
LIVE
Sean Unpaved
1 hour agoThursday Night Thrills & Kawhi's No-Show Gig in LA
119 watching -
 LIVE
LIVE
StoneMountain64
49 minutes agoTOP GHILLIE SNIPERS play Warzone's NEW UPDATE
56 watching -
 LIVE
LIVE
Reidboyy
40 minutes agoHow To Make $$$ in Delta Force Console Operations!
23 watching -
 1:00:35
Timcast
2 hours agoDOJ To BAN Transgenders From Owning Guns
101K104 -
 LIVE
LIVE
Side Scrollers Podcast
2 hours agoUK JAILS TV WRITER FOR WRONG THINK + TWITCH ALLOWS CYBERSTALKING + MORE | SIDE SCROLLERS LIVE
316 watching -
 LIVE
LIVE
Viss
1 hour ago🔴LIVE - PUBG Solo Tactics To Win Consistently! - PUBG 101
92 watching -
 2:05:54
Steven Crowder
4 hours agoLive Reaction: RFK Faces Senate Grilling After Employees Demand His Resignation
261K188 -
 1:02:58
The Rubin Report
3 hours agoPress Stunned by Trump’s Brutally Honest Message for Elon Musk
46.7K41