How to Create a Streamgraph in Python
How to Create a Streamgraph in Python | Easy Data Visualization Tutorial
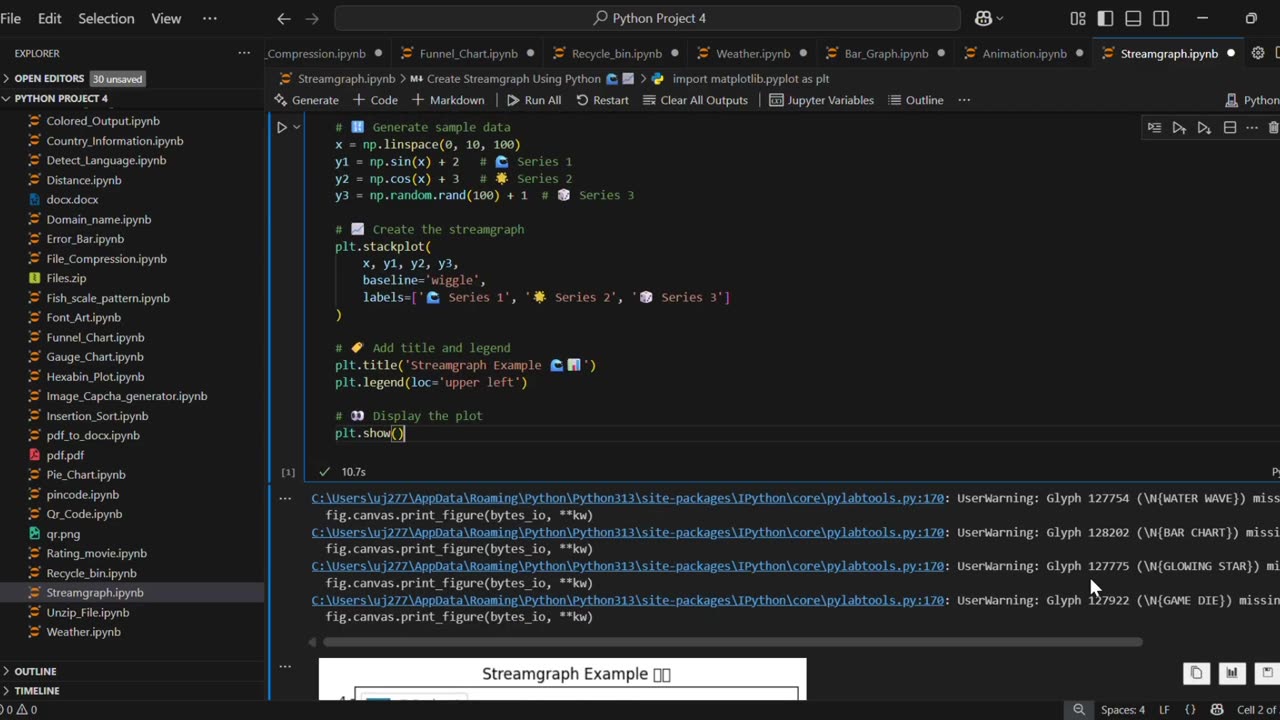
In this video, you’ll learn how to create a Streamgraph using Python and Matplotlib. A streamgraph is a type of stacked area chart with a smooth, flowing baseline, making it visually appealing for data visualization.
✅ What you’ll learn:
How to generate sample data in Python
How to plot a Streamgraph using matplotlib.stackplot()
Customize titles, labels, and legends for better visuals
This tutorial is beginner-friendly and perfect for anyone learning Python data visualization. 🚀
#Python #Matplotlib #DataVisualization #PythonProjects #Streamgraph #PythonForBeginners #PythonTutorial #LearnPython #PythonMatplotlib #PythonCharts
🔔 Subscribe for more Python, Data Science, and Data Visualization tutorials!
-
 0:58
0:58
AI Evolutionary Technology
8 days agoCreate Amazing Animated Scatter Plots in Python
6 -
 1:02:00
VINCE
3 hours agoThe Left's Demented Fantasies Shatter | Episode 117 - 09/03/25
135K40 -
 DVR
DVR
Nikko Ortiz
1 hour agoLive - Reaction Time, News, Politics, and More!
4.83K -
 LIVE
LIVE
LFA TV
4 hours agoLFA TV ALL DAY STREAM - WEDNESDAY 9/3/25
4,956 watching -
 LIVE
LIVE
MYLUNCHBREAK CHANNEL PAGE
2 hours agoHistory’s Most SHOCKING Claims?
426 watching -
 LIVE
LIVE
Caleb Hammer
2 hours agoThe First LGBT Divorce On Financial Audit
110 watching -
 LIVE
LIVE
Badlands Media
1 hour agoBadlands Daily: September 3, 2025 (#2)
3,305 watching -
 LIVE
LIVE
Jim Jordan
1 hour agoEurope’s Threat to American Speech and Innovation
488 watching -
 LIVE
LIVE
The State of Freedom
5 hours agoFLF: #16 Delivering the Truth Comes at a Cost w/ Joe Hoft
16 watching -
 31:01
31:01
Rethinking the Dollar
1 hour agoWe're In A NEW Monetary Reality! Xi & Putin Knows How This ENDS | Morning Check-In: Let's Talk...
5.97K