How to Create a Streamgraph in Python
How to Create a Streamgraph in Python | Easy Data Visualization Tutorial
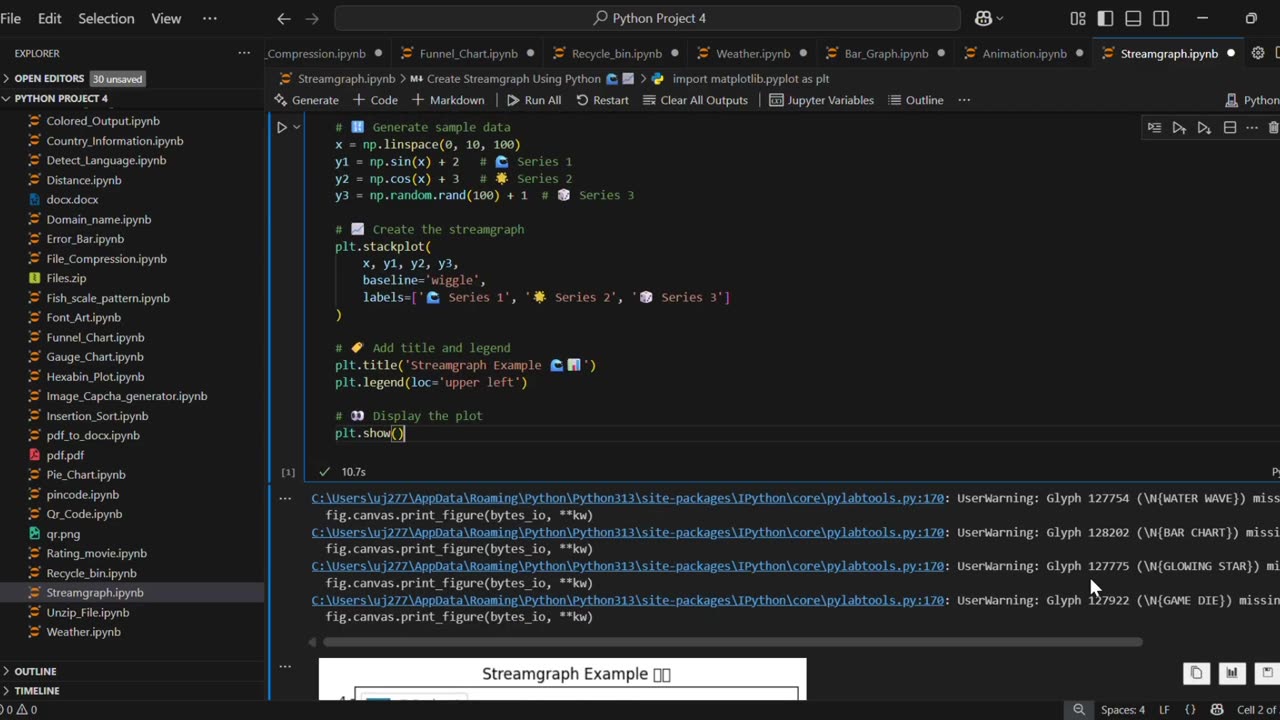
In this video, you’ll learn how to create a Streamgraph using Python and Matplotlib. A streamgraph is a type of stacked area chart with a smooth, flowing baseline, making it visually appealing for data visualization.
✅ What you’ll learn:
How to generate sample data in Python
How to plot a Streamgraph using matplotlib.stackplot()
Customize titles, labels, and legends for better visuals
This tutorial is beginner-friendly and perfect for anyone learning Python data visualization. 🚀
#Python #Matplotlib #DataVisualization #PythonProjects #Streamgraph #PythonForBeginners #PythonTutorial #LearnPython #PythonMatplotlib #PythonCharts
🔔 Subscribe for more Python, Data Science, and Data Visualization tutorials!
-
 0:14
0:14
AI Evolutionary Technology
2 days agoFind Programming Language Trends Using Python
-
 LIVE
LIVE
Barry Cunningham
5 hours agoNOW THEY FEAR US! | RFKJR STRIKES BACK | JD VANCE ON PRESIDENT TRUMP | AND MORE NEWS!
1,567 watching -
 8:18
8:18
MattMorseTV
1 hour ago $0.80 earned2.2 MILLION in ONE YEAR.
1.74K58 -
 14:37
14:37
Colion Noir
5 hours agoCanadian Police Chief Urges Citizens To Comply With Home Invaders And Hide
22.5K36 -
 1:18:54
Jeff Ahern
3 hours ago $9.74 earnedThe Sunday Show with Jeff Ahern
39.8K4 -
 32:05
32:05
Tactical Advisor
3 hours agoNew Thermal Target for the Military | Vault Room Live Stream 038
23.9K2 -
 LIVE
LIVE
GamerGril
2 hours agoThe Evil Within 2 💕 Pulse Check 💕 Still Here
92 watching -
 LIVE
LIVE
ttvglamourx
6 hours ago $0.26 earnedPLAYING WITH VIEWERS !DISCORD
92 watching -
 LIVE
LIVE
TheManaLord Plays
7 hours agoMANA SUMMIT - DAY 2 ($10,200+) | BANNED PLAYER SMASH MELEE INVITATIONAL
188 watching -
 LIVE
LIVE
Jorba4
3 hours ago🔴Live-Jorba4- The Finals
102 watching