How to Create a Streamgraph in Python
How to Create a Streamgraph in Python | Easy Data Visualization Tutorial
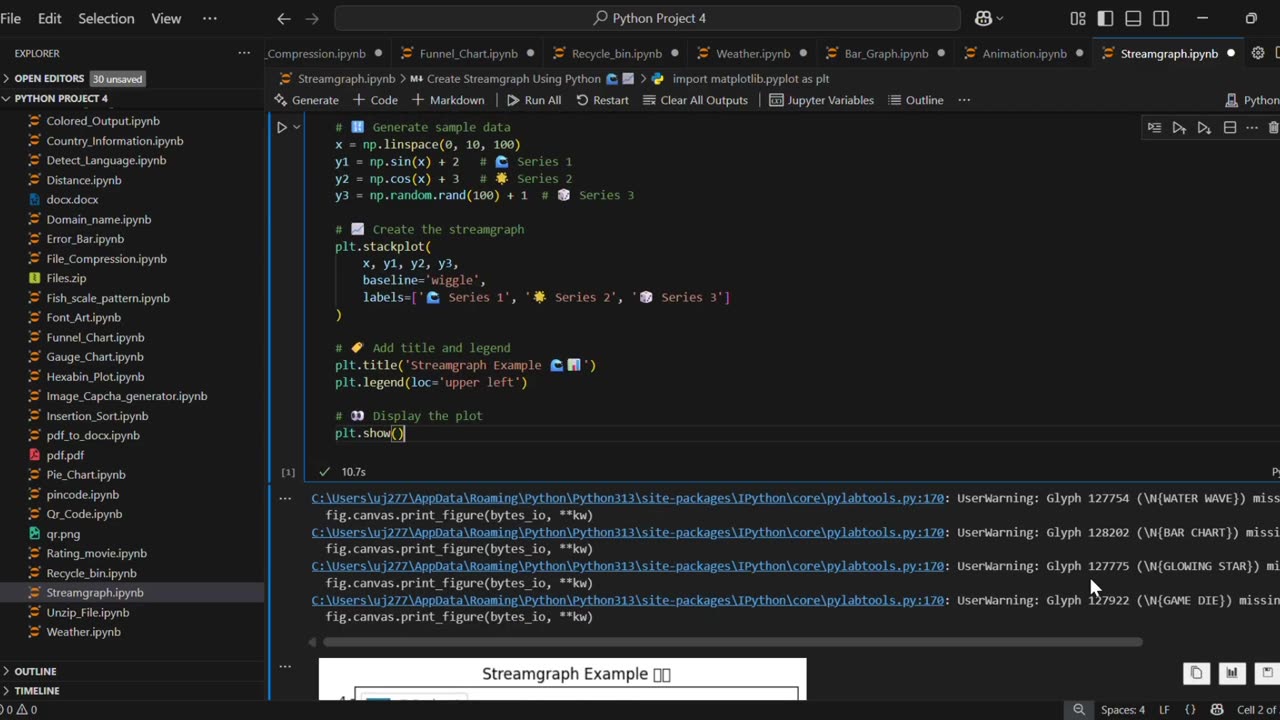
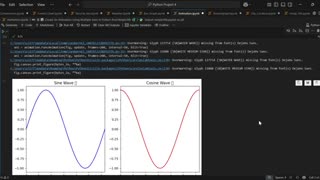
In this video, you’ll learn how to create a Streamgraph using Python and Matplotlib. A streamgraph is a type of stacked area chart with a smooth, flowing baseline, making it visually appealing for data visualization.
✅ What you’ll learn:
How to generate sample data in Python
How to plot a Streamgraph using matplotlib.stackplot()
Customize titles, labels, and legends for better visuals
This tutorial is beginner-friendly and perfect for anyone learning Python data visualization. 🚀
#Python #Matplotlib #DataVisualization #PythonProjects #Streamgraph #PythonForBeginners #PythonTutorial #LearnPython #PythonMatplotlib #PythonCharts
🔔 Subscribe for more Python, Data Science, and Data Visualization tutorials!
-
 0:52
0:52
AI Evolutionary Technology
12 days agoCreate Synchronized Multi-Plot Animations in Python
91 -
 27:40
27:40
TheRoyaltyAutoService
14 hours ago $0.05 earnedHow To Replace A Battery Like A Professional!
39 -
 8:52
8:52
The Art of Improvement
19 hours ago7 Habits Of Unsuccessful People You Don’t Want To Copy
42 -
 36:17
36:17
Uncommon Sense In Current Times
15 hours agoIs Humanism A Religion in Disguise: A Discussion with Humanist Stephen Law - Part 1
5.65K -
 30:07
30:07
Degenerate Plays
14 hours agoReverse Captain America! - Call of Duty: Modern Warfare 2 (2009) : Part 1
22 -
 7:56
7:56
Faith Frontline
12 hours agoCIA Spy CONFIRMS Bible Prophecy Is Playing Out Right Now
59 -
 1:25:26
Coin Stories with Natalie Brunell
20 hours agoCan the State Crush Bitcoin? And the Next Big Financial Crisis with Dave Collum
18.6K1 -
 26:38
26:38
DeVory Darkins
1 day ago $6.65 earnedNewsom suffers CRUSHING LOSS after SCOTUS ruling hands Trump HISTORIC WIN
8.32K71 -
 11:23
11:23
Nikko Ortiz
1 day agoArmy Tik Tok Fails Go Hard
66K7 -
 2:27:44
Side Scrollers Podcast
20 hours agoSilksong is “TRANS CODED” + YouTube GASLIGHTS Creators + Asmongold Stops Streaming | Side Scrollers
10.4K19