How to Create a Streamgraph in Python
How to Create a Streamgraph in Python | Easy Data Visualization Tutorial
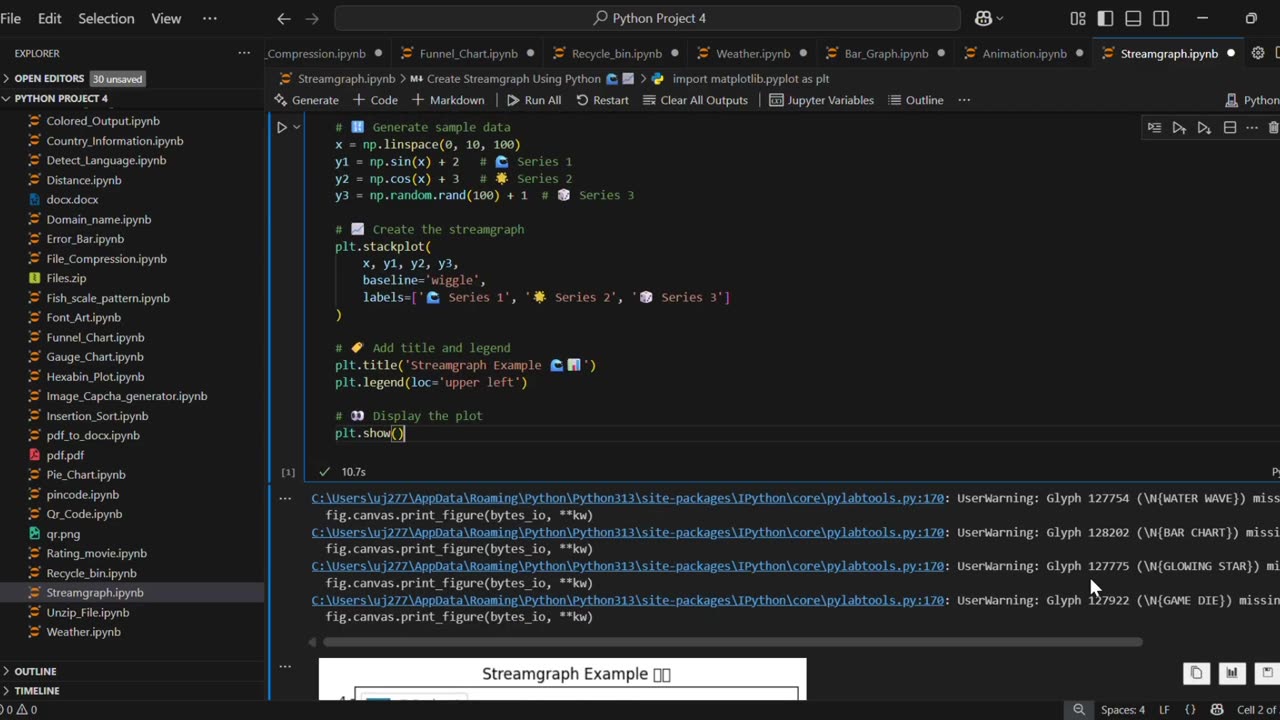
In this video, you’ll learn how to create a Streamgraph using Python and Matplotlib. A streamgraph is a type of stacked area chart with a smooth, flowing baseline, making it visually appealing for data visualization.
✅ What you’ll learn:
How to generate sample data in Python
How to plot a Streamgraph using matplotlib.stackplot()
Customize titles, labels, and legends for better visuals
This tutorial is beginner-friendly and perfect for anyone learning Python data visualization. 🚀
#Python #Matplotlib #DataVisualization #PythonProjects #Streamgraph #PythonForBeginners #PythonTutorial #LearnPython #PythonMatplotlib #PythonCharts
🔔 Subscribe for more Python, Data Science, and Data Visualization tutorials!
-
 0:20
0:20
AI Evolutionary Technology
1 month agoUsing Python to Analyze Your Internet Connection
171 -
 18:08
18:08
Professor Nez
1 hour ago🚨HOLY CRAP: Members of Congress Call for Military INSURRECTION!
33.8K49 -
 LIVE
LIVE
Grant Cardone
4 hours agoHow to Buy Real Estate With NO Money Down (LIVE Training With Grant Cardone)
1,348 watching -
 LIVE
LIVE
AlaskanBallistics
11 hours agoShooting the WhisperStrike WT30 Live!
72 watching -
 19:53
19:53
MetatronHistory
18 hours agoRome VS Greece - Ultimate Clash of Civilizations Explained
38.7K9 -
 LIVE
LIVE
The Big Mig™
4 hours agoThe Big Mig Show's Greatest Hits w/ Americas Future, Karmageddon, Operation Gideon,..
102 watching -
 1:32:33
VapinGamers
3 hours ago $4.46 earnedTools of the Trade - EP12 The Art of Story Telling with MidnightinTheMountains - !rumbot !music
17.6K2 -
 LIVE
LIVE
SOLTEKGG
2 hours ago🔴LIVE - Battlefield 6 - Going Pro in RED SEC
186 watching -
 LIVE
LIVE
Midnight In The Mountains™
4 hours agoThe Midnights Play Arc Raiders | Loot Scoot and KILL | Crypto Wallet up n running GO JOIN THE BETA!
97 watching -
 53:25
53:25
X22 Report
5 hours agoMr & Mrs X - Trump Is Using The Same Tactic As Our Founding Fathers To Rebuild America - EP 17
89K23