Exp19_Excel_Ch05_HOEAssessment_Fine_Art Microsoft Excel Pearson MyLab IT Assessment Fine Art (2025)
Exp19_Excel_Ch05_HOEAssessment_Fine_Art
Project Description:
You are an analyst for a fine art dealer. Customers are especially fond of James C. Christensen’s art. You prepared a list of his artwork: Title (title of each piece of art), Type (the medium, such as Limited Edition Print or Anniversary Edition Canvas), Edition Size (how many copies were produced for purchase), Release date (the month and year the art was released), Issue Price (the original retail price when the art was released), and Est. Value (the estimated current market value). Studying the data will help you discuss value trends with art collectors
Steps to Perform:
Step Instructions Points Possible
1 Start Excel. Download and open the file named Exp19_Excel_Ch05_HOEAssessment_FineArt.xlsx. Grader has automatically added your last name to the beginning of the filename. 0
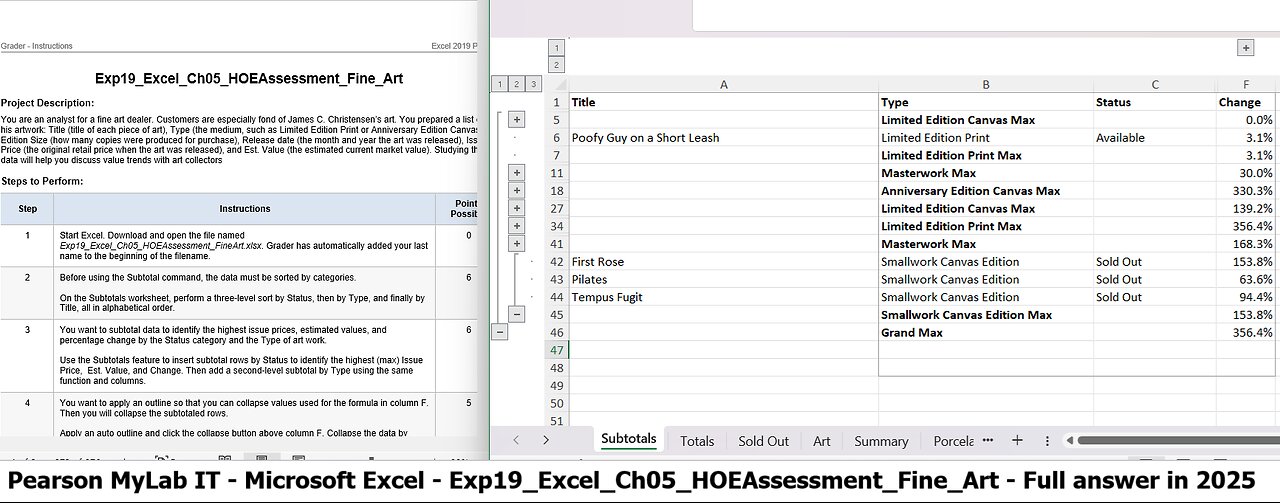
2 Before using the Subtotal command, the data must be sorted by categories.
On the Subtotals worksheet, perform a three-level sort by Status, then by Type, and finally by Title, all in alphabetical order. 6
3 You want to subtotal data to identify the highest issue prices, estimated values, and percentage change by the Status category and the Type of art work.
Use the Subtotals feature to insert subtotal rows by Status to identify the highest (max) Issue Price, Est. Value, and Change. Then add a second-level subtotal by Type using the same function and columns. 6
4 You want to apply an outline so that you can collapse values used for the formula in column F. Then you will collapse the subtotaled rows.
Apply an auto outline and click the collapse button above column F. Collapse the data by displaying only the subtotals and grand total rows. Set a print area for the range B1:F48. 5
5 A PivotTable can give additional perspective to data. You will use the Art worksheet to create a recommended PivotTable.
Use the Art worksheet to create the recommended PivotTable called Sum of Issue Price by Type on a new worksheet named Sold Out. Mac users create a PivotChart that includes the Status field in the Filters area, the Est. Values field in the Columns area, the Type field in the Rows area, and the Issue Price field in the Values area.
Name the PivotTable Art Type. 5
6 Currently, the PivotTable contains the Issue Price field. You will add the Est. Value field to compare the difference between total value of the art based on issue price and estimated value today.
Add the Est. Value field below the Sum of Issue Price in the Values area. 5
7 You want to display the average values instead of the sum of the values in each category.
Modify the two Values fields to determine the average Issue Price and average Est. Value by type. Change the custom name to Average Issue Price and Average Est. Value, respectively. 8
8 Format the two Values fields with Accounting number type with zero decimal places. 5
9 The Summary sheet is designed to display two key averages from the PivotTable on the Summary sheet.
Display the Summary sheet. In cell B2, insert the GETPIVOTDATA function that references cell C4 on the PivotTable in the Sold Out sheet. In cell B3, insert the GETPIVOTDATA function that references cell C9 on the PivotTable in the Sold Out sheet. 4
10 Some art is still available, but most art is sold out. You want to create a filter to focus on the sold-out art.
Display the Sold Out sheet. Add the Status field from the field list to the Filters area. Set a filter to display only art that is Sold Out. 5
11 Insert a slicer for the Type field, change the slicer height to 2 inches, change the button width to 2 inches, and apply the Light Blue, Slicer Style Dark 5. Cut the slicer and paste it in cell A11.
Note, depending upon the Office version used, the style name may be Slicer Style Dark 1. 7
12 Display the Totals sheet. Insert a calculated field named Field1 to determine difference between the two values, Est. Value and Issue Price. Change the custom name to Value Increase.
6
13 With the PivotTable on the Totals sheet displayed, change the Sum of Issue Price and Sum of Est. Value fields to show values as percentage of column totals. 6
14 With the PivotTable on the Totals sheet displayed, select Light Blue, Pivot Style Medium 6 and display banded rows. 5
15 Display the Porcelains sheet. Create a relationship between the PORCELAINS table using the Code field and the CODES table using the Code field. 5
16 Create a blank PivotTable from inside the PORCELAINS table. Add this data to the Data Model. Name the worksheet Porcelain Pivot and name the PivotTable Porcelain Values. 3
17 Display all tables in the PivotTable Fields List task pane. Add the Description from the CODES table to the Rows area and the Issue and Est. Value fields as Values from the PORCELAIN table. Format the two value fields with Accounting number format with zero decimal places. 6
18 Create a clustered column PivotChart from the Porcelain Values PivotTable. Cut the PivotChart and paste it in cell A7. 4
19 Add a chart title and type Porcelain Values. Bold the title. Change the value axis maximum bounds to $3,000. 5
20 Change the PivotChart height to 2.5 inches and the width to 3.7 inches. 2
21 Create a footer on all worksheets (except Art) with your name in the left section, the sheet name code in the center section, and the file name code in the right section. 2
22 Ensure that the worksheets are correctly named and placed in the following order in the workbook: Subtotals, Totals, Sold Out, Art, Summary, Porcelain Pivot, Porcelains. 0
23 Save and close Exp19_Excel_Ch05_HOEAssessment_FineArt.xlsx. Exit Excel. Submit the file as directed 0
Total Points 100
#Microsoft
#MicrosoftOffice
#MicrosoftExcel
#PearsonMyLabIT
#Pearson
-
 37:25
37:25
Nikko Ortiz
14 hours agoTerrible Military Deaths and War Crimes
10.6K7 -
 24:21
24:21
The Pascal Show
9 hours ago $6.09 earned'CHALLENGE ACCEPTED!' TPUSA Breaks Silence On Candace Owens Charlie Kirk Allegations! She Responds!
14.5K7 -
 19:23
19:23
MetatronHistory
15 hours agoThe REAL Origins and Function of the PRETORIANS in Ancient Rome
9.38K -
 2:03:59
Side Scrollers Podcast
19 hours agoKaceytron Publicly Humiliated by H3H3 + Sabrina Carpenter/White House FEUD + More | Side Scrollers
55.8K7 -
 2:17:46
The Connect: With Johnny Mitchell
4 days ago $17.43 earnedA Sitdown With The Real Walter White: How An Honest Citizen Became A Synthetic Drug Kingpin
100K2 -
 2:40:08
PandaSub2000
1 day agoDEATH BET | Solo Episode 01 (Edited Replay)
26.1K1 -
 9:41
9:41
Blabbering Collector
2 days agoHarry Potter Vintage Christmas Merch By Realtec Canada!
10.3K1 -
 LIVE
LIVE
Lofi Girl
2 years agoSynthwave Radio 🌌 - beats to chill/game to
703 watching -
 3:29:19
FreshandFit
16 hours agoMilo Yiannopoulos & Akademiks Find Out Who This Girl Smashed...
241K212 -
 2:08:35
Badlands Media
15 hours agoDevolution Power Hour Ep. 412 - Monroe Doctrine, Durham Rug, Income Taxes, and MORE!
90.1K17