
Create Stunning 3D Contour Plots in Python
Create Stunning 3D Contour Plots in Python | Matplotlib Tutorial
🐍 Learn how to create professional and visually stunning 3D contour plots using Python and Matplotlib in this step-by-step tutorial!
Medium Articles:
# / create-3d-contour-plot-using-python
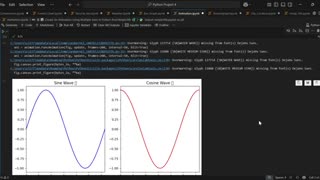
In this video, I'll guide you through the entire process of building a 3D graph from scratch. We'll cover how to generate data with NumPy, define a mathematical function, and use Matplotlib's 3D toolkit to visualize it. Perfect for data visualization, scientific computing, and adding a wow factor to your projects!
⭐ In this video, you'll learn how to:
Set up your Python environment for 3D plotting
Generate data using np.linspace and np.meshgrid
Define a mathematical function (using a radial sine wave)
Create a 3D figure and axis with projection='3d'
Plot the surface using ax.contour3D
Customize the plot with colormaps, labels, and a title
Add a colorbar to interpret the Z-values
Adjust the viewing angle for the perfect perspective
🔔 Subscribe for more Python tutorials, data science tips, and coding projects!
#python #matplotlib #datavisualization #pythonprogramming #numpy #coding #learnpython #pythonforbeginners #dataanalysis #datascience #scientificcomputing #tech #softwareengineering #howtocode #pythonplotting #3dplot #contourplot #3dgraph #matplotlib3d
-
 0:52
0:52
AI Evolutionary Technology
4 days agoCreate Synchronized Multi-Plot Animations in Python
91 -
 38:39
38:39
Grant Stinchfield
2 hours ago $0.41 earnedHow Local TV News LOST Its Soul
4.12K2 -
 2:09:51
Badlands Media
13 hours agoBadlands Daily: September 1, 2025
32.4K26 -
 1:12:35
theoriginalmarkz
3 hours agoCoffee with MarkZ. 09/01/2025
33.4K12 -
 2:59:48
Wendy Bell Radio
8 hours agoSunday, Bloody Sunday
113K248 -
 1:10:02
crgoodw1n
2 hours agoHAPPY LABOR DAY! Tactical shoosting W/ @BenderOdoyle Ask about !12hr !freshenup !discord
7.67K2 -
 LIVE
LIVE
ENEMYOFDEATH2012
14 hours agoGod of War Playthrough Pt. 2 and some Fortnite
16 watching -
 4:47:50
The Why Files
3 days agoCOMPILATION: UFOs and Aliens Vol.2 | They are NOT our friends
92.2K54 -
 1:33:46
BubbaMatt
3 hours ago $0.08 earnedMafia Definitive Edition Playthrough - Part 1
3.13K -
 LIVE
LIVE
Jorba4
2 hours ago🔴Live-Jorba4- The Finals
7 watching