Premium Only Content
This video is only available to Rumble Premium subscribers. Subscribe to
enjoy exclusive content and ad-free viewing.

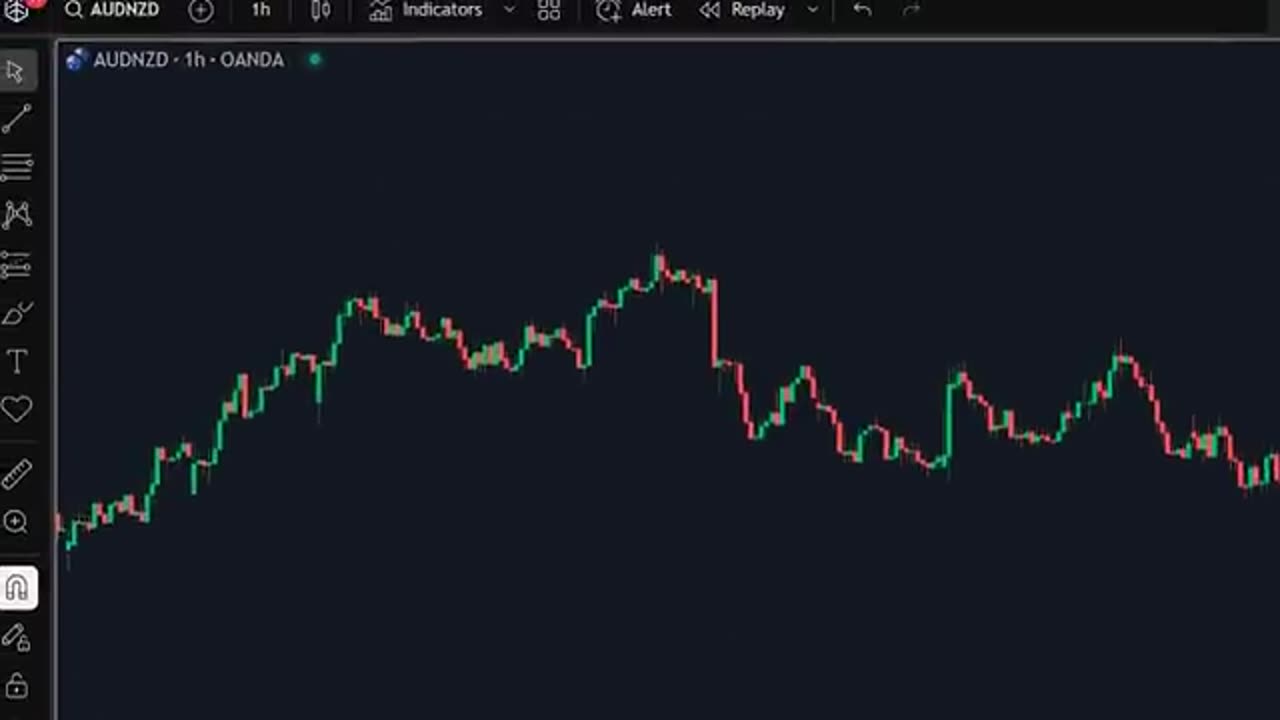
Nouvel Indicateur de Support Résistance se base sur le Volume pour plus de Précision
1 month ago
3
Meet the Volumatic Support Resistance Levels by BigBeluga—a volume-powered way to read where and why price reacts. 🧠📊 Colored zones mark support (🟢) and resistance (🔴), with histogram fills and circle markers flagging true volume hotspots. Combine it with VIDIA’s trend cloud and Delta Volume to filter entries: green cloud + orange candle at confirmed support with ≥ +10% delta for longs; red cloud + orange candle that breaks recent support with ≤ −10% delta for shorts. 🎯 Stops tuck beyond the signal candle; typical target ~1.5R. Add the Pinetrades Market Beacon for final confluence. Not financial advice—blend with your own analysis. 📈
Loading comments...
-
 16:23
16:23
True Crime | Unsolved Cases | Mysterious Stories
1 month ago $3.71 earnedThe Strange Disappearance of Mekayla Bali | (Mini-Documentary)
28.6K4 -
 10:03
10:03
nospeedlimitgermany
12 days ago $6.71 earnedVW Golf 5 R32 | 250 PS | Top Speed Drive German Autobahn No Speed Limit POV
33.1K5 -
 1:35
1:35
Memology 101
1 day ago $4.43 earnedChicago Mayor Johnson calls LAW ENFORCEMENT a "SICKNESS" he will "ERADICATE"
30.1K40 -
 10:17
10:17
Advanced Level Diagnostics
13 days ago $5.33 earned2007 Chevy Express - Replaced Everything But The Code Remains!
36.3K -
 1:01:11
The Mel K Show
7 hours agoMel K & Harley Schlanger | History Repeats: A Wake-Up Call for Humanity | 9-20-25
100K29 -
 2:13:52
Mally_Mouse
15 hours ago🌶️ 🥵Spicy BITE Saturday!! 🥵🌶️- Let's Play: Lockdown Protocol (New Updates!)
95.7K6 -
 12:57
12:57
Culture Apothecary with Alex Clark
1 day agoMy Last 6 Years With Charlie Kirk | In Memoriam with Alex Clark
42.8K10 -
 2:48:55
Barry Cunningham
12 hours agoPRESIDENT TRUMP WILL ENSURE THAT CHARLIE KIRK DID NOT DIE IN VAIN!
77.8K126 -
 2:14:52
SavageJayGatsby
12 hours ago🔥 Spicy Saturday - Let's Play: Lockdown Protocol 🔥
100K2 -
 4:22:17
GamerGril
1 day ago💕 Dying Light The Beast 💕 ✨My New Favorite Game✨
37.9K16