Create Dynamic Bar & Line Graphs with HTML5 & JavaScript – Beginner Friendly!
In this screencast, learn how to build a fully functional spreadsheet-like graph plotter using only HTML5, CSS3, and vanilla JavaScript.
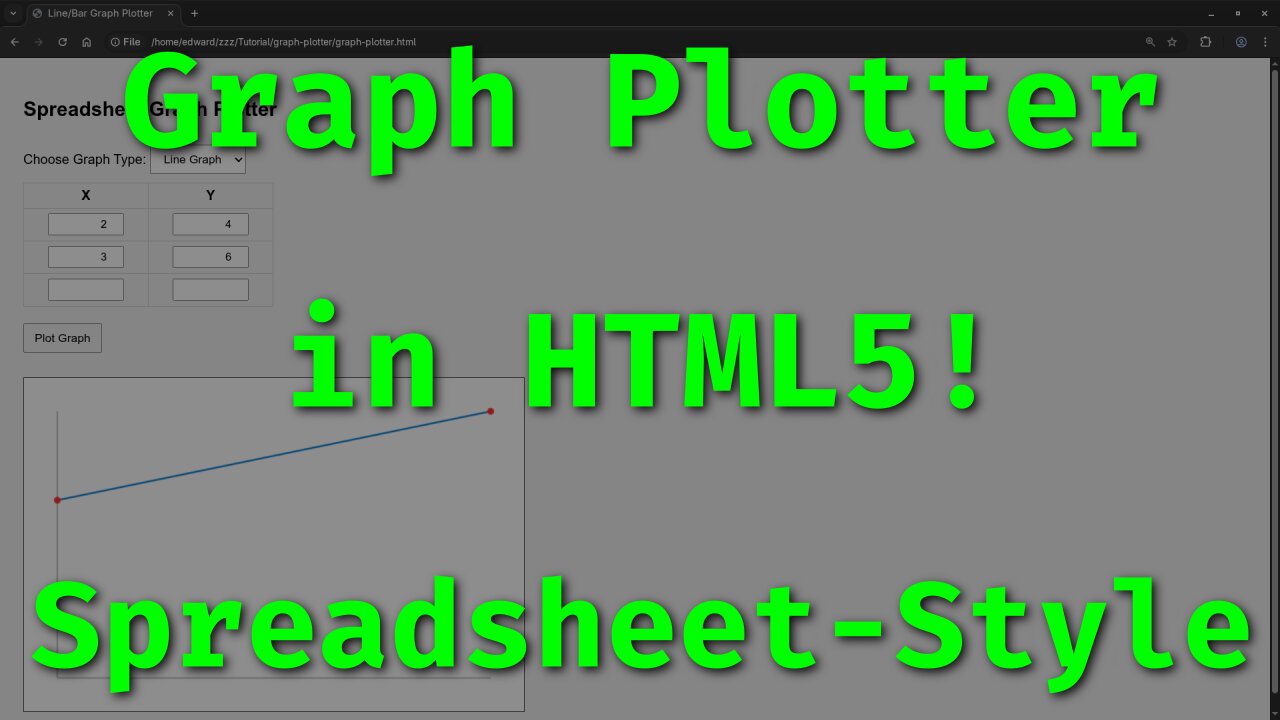
Watch step-by-step as we create a dynamic data input table that automatically adds rows, and plots both bar and line graphs on the canvas element — no frameworks needed!
This tutorial is perfect for beginners who want to practice JavaScript basics and get hands-on experience with DOM manipulation and canvas graphics.
What you will learn:
How to create a spreadsheet-style input table with dynamic rows
Plot bar graphs and line graphs with canvas
Handle user input and draw scalable graphs dynamically
Basic event handling in JavaScript
Try out the full project code and detailed explanation here:
https://www.ojambo.com/build-an-html5-spreadsheet-like-graph-plotter-with-javascript
Interested in learning JavaScript more deeply? Check out my beginner’s book and course:
Book: https://www.amazon.com/Learning-JavaScript-Programming-Beginner-Guide/dp/B0DRDB2P2P
Course: https://ojamboshop.com/product/learning-javascript
Need personalized help? Contact me for one-on-one programming tutorials including JavaScript:
https://ojambo.com/contact
#JavaScriptTutorial #HTML5Canvas #WebDevelopment #CodingForBeginners #LearnJavaScript #GraphPlotter #BarGraph #LineGraph
-
 48:08
48:08
OjamboShop
1 day agoCreate a 3D Snowman with Blender Python API – Full Web Integration Tutorial
101 -
 LIVE
LIVE
Viss
4 hours ago🔴LIVE - Completing Quests & Annihilating All in Our Path! - Arc Raiders!
76 watching -
 53:51
53:51
The Rubin Report
3 hours agoBill Maher Obliterates Patton Oswalt’s Liberal Bubble in Only 2 Minutes
37.5K42 -
 LIVE
LIVE
LumpyPotatoX2
3 hours agoWhere Winds Meet: Just Petting Kitties - Made in China
59 watching -
 LIVE
LIVE
ReAnimateHer
18 hours ago $0.12 earnedTwisted Tales & True Crime - Inbred Byrd Sisters & Graysone Homestead
113 watching -
 1:08:01
iCkEdMeL
2 hours ago $1.06 earned🚨Mom Gives Birth on Highway After Kicked Out of Hospital?!
17.3K2 -
 14:28
14:28
Clownfish TV
4 hours agoDisney is DONE with DEI?! | Clownfish TV
9.17K9 -
 LIVE
LIVE
LFA TV
16 hours agoLIVE & BREAKING NEWS! | TUESDAY 11/18/25
2,668 watching -
 LIVE
LIVE
The Shannon Joy Show
2 hours agoLicense To Kill - The PREP Act, BARDA & How The US Government Legalized Democide. LIVE With Sasha Latypova
286 watching -
 32:16
32:16
Grant Stinchfield
2 hours ago $1.23 earnedAI Sam Altman’s Baby Lab: Silicon Valley Tries to Play God!
9.72K1