INSTANT GOLDENAGE MASTERMIND #TOPloserZ stock trading
-1 #myFGFanalysis $FGF | 2 #myTTDanalysis $TTD 3 #mySRTSanalysis $SRTS
4 #mySEZLanalysis $SEZL 5 #myFNKOanalysis $FNKO | 6 #myINUVanalysis $INUV
7 #myBIRDanalysis $BIRD | 8 #myPMTSanalysis $PMTS 9 #myVTEXanalysis $VTEX
10 #myXPOFanalysis $XPOF
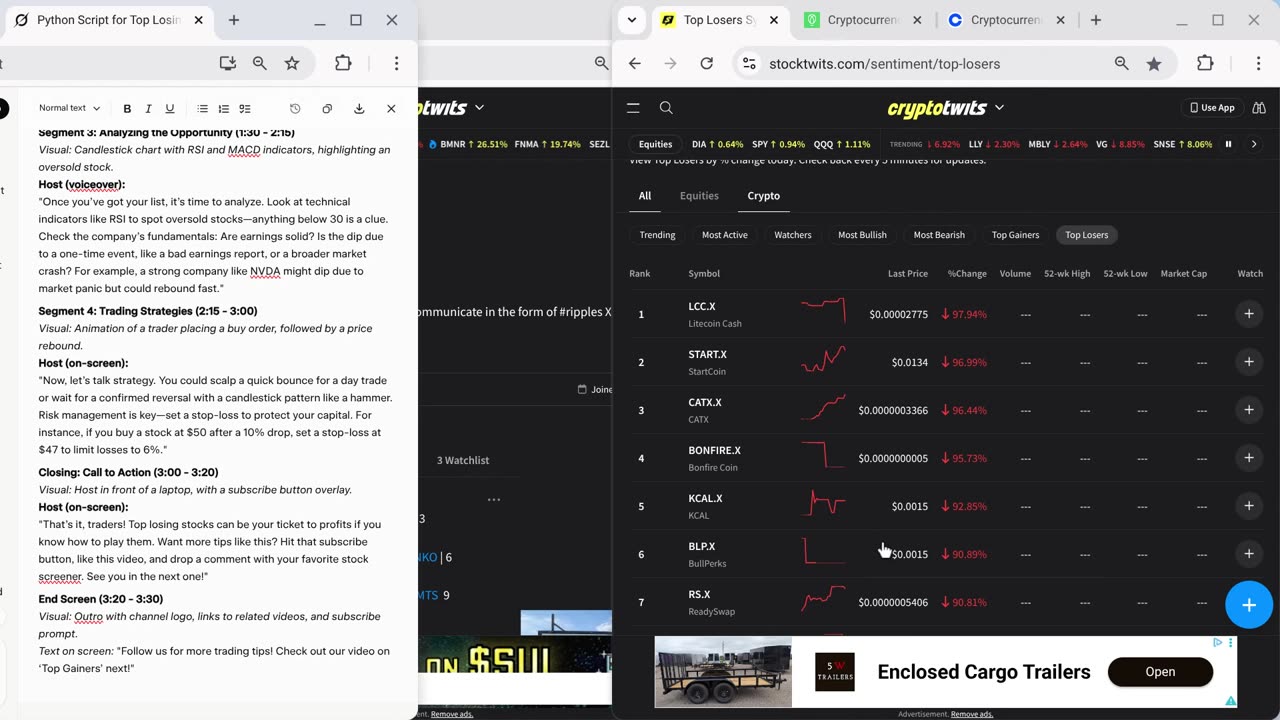
- #TOPloserZ #FRIDdayZ #20of28Z #stocktwits
#WorkHard #Effortlessly #YOURhashtagHERE
*Tradeable 1D Biggest Percent Change DOWN High to LOW. It doesn't have to be right it just has to be consistent. SEE THIS POST AGAIN on #FRIDdayZ
Stock Trading Video Script: Finding Opportunities in Top Losing Stocks
Opening Scene (0:00 - 0:15)
Visual: Energetic music, stock market charts zooming in.
Host (on-screen):
"Hey, traders! Welcome back to [Your Channel Name]! Today, we’re diving into a strategy that can turn losses into wins: finding opportunities in the market’s top losing stocks. Let’s get started!"
Segment 1: Why Look at Top Losers? (0:15 - 0:45)
Visual: Table showing stock tickers with red arrows indicating price drops.
Host (voiceover):
"You might think losing stocks are bad news, but for savvy traders, they’re a goldmine. Why? Top losers often signal oversold conditions, undervaluation, or short-term dips that could reverse. Whether you’re a day trader or a long-term investor, these stocks can offer entry points for big gains."
Segment 2: How to Find Top Losers (0:45 - 1:30)
Visual: Screencast of a stock screener (e.g., Yahoo Finance, FinViz) filtering for daily losers.
Host (on-screen):
"So, how do you find these stocks? Use a stock screener! Platforms like Yahoo Finance, TradingView, or FinViz let you filter for the biggest percentage drops in a day. For example, let’s say TSLA is down 8% today. That’s a red flag, but also a chance to investigate. Check the volume, news, and sector trends to see why it’s dropping."
Segment 3: Analyzing the Opportunity (1:30 - 2:15)
Visual: Candlestick chart with RSI and MACD indicators, highlighting an oversold stock.
Host (voiceover):
"Once you’ve got your list, it’s time to analyze. Look at technical indicators like RSI to spot oversold stocks—anything below 30 is a clue. Check the company’s fundamentals: Are earnings solid? Is the dip due to a one-time event, like a bad earnings report, or a broader market crash? For example, a strong company like NVDA might dip due to market panic but could rebound fast."
Segment 4: Trading Strategies (2:15 - 3:00)
Visual: Animation of a trader placing a buy order, followed by a price rebound.
Host (on-screen):
"Now, let’s talk strategy. You could scalp a quick bounce for a day trade or wait for a confirmed reversal with a candlestick pattern like a hammer. Risk management is key—set a stop-loss to protect your capital. For instance, if you buy a stock at $50 after a 10% drop, set a stop-loss at $47 to limit losses to 6%."
Closing: Call to Action (3:00 - 3:20)
Visual: Host in front of a laptop, with a subscribe button overlay.
Host (on-screen):
"That’s it, traders! Top losing stocks can be your ticket to profits if you know how to play them. Want more tips like this? Hit that subscribe button, like this video, and drop a comment with your favorite stock screener. See you in the next one!"
End Screen (3:20 - 3:30)
Visual: Outro with channel logo, links to related videos, and subscribe prompt.
Text on screen: "Follow us for more trading tips! Check out our video on ‘Top Gainers’ next!"
-
 LIVE
LIVE
Side Scrollers Podcast
1 hour agoStreamer ATTACKS Men Then Cries Victim + Pronoun Rant Anniversary + More | Side Scrollers
338 watching -
 12:06
12:06
Liberty Hangout
1 day agoDemocrat Woman Can't Define 'Woman'
20.7K38 -
 LIVE
LIVE
GritsGG
4 hours agoRumble Customs! 3515 Ws! 🫡!
517 watching -
 38:39
38:39
Grant Stinchfield
2 hours ago $0.41 earnedHow Local TV News LOST Its Soul
4.12K2 -
 2:09:51
Badlands Media
12 hours agoBadlands Daily: September 1, 2025
32.4K23 -
 1:12:35
theoriginalmarkz
3 hours agoCoffee with MarkZ. 09/01/2025
33.4K9 -
 2:59:48
Wendy Bell Radio
8 hours agoSunday, Bloody Sunday
113K233 -
 1:10:02
crgoodw1n
2 hours agoHAPPY LABOR DAY! Tactical shoosting W/ @BenderOdoyle Ask about !12hr !freshenup !discord
7.67K2 -
 LIVE
LIVE
ENEMYOFDEATH2012
14 hours agoGod of War Playthrough Pt. 2 and some Fortnite
18 watching -
 4:47:50
The Why Files
2 days agoCOMPILATION: UFOs and Aliens Vol.2 | They are NOT our friends
92.2K53