Create a Funnel Chart in Python with Matplotlib Step by Step Guide
Create a Funnel Chart in Python with Matplotlib Step by Step Guide
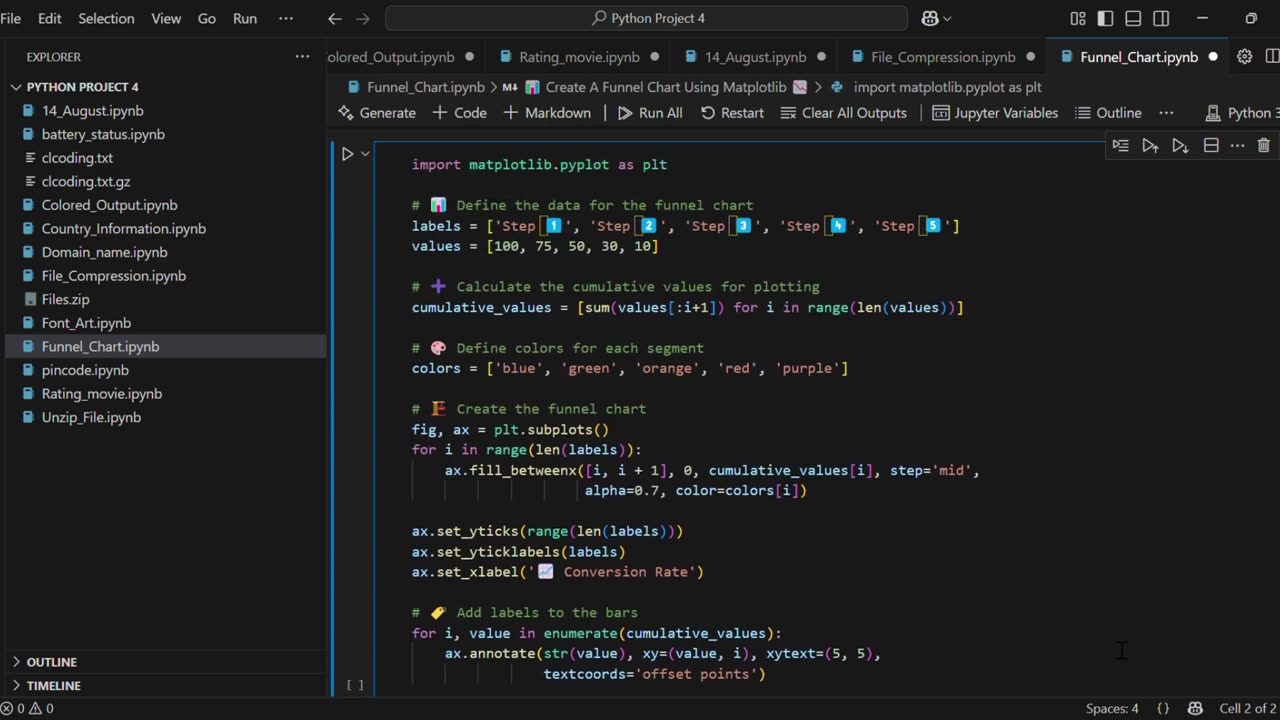
In this Python tutorial, you'll learn how to create a Funnel Chart step by step using the powerful Matplotlib library. Funnel charts are useful for visualizing processes like sales pipelines, user drop-off, and conversion rates in a simple and visual format.
📊 What You’ll Learn:
How to prepare data for a funnel chart
Creating a custom funnel chart using fill_betweenx()
Adding colors, labels, and formatting for clarity
Fixing common plotting errors in Matplotlib
📌 Perfect For:
Data Analysts
Python beginners
Students working on data visualization projects
💡 No extra libraries needed — just Matplotlib!
🔔 Subscribe for more Python data visualization tutorials.
#Python #programming #FunnelChart #codding #learnpython #pythonprogramming #scatterplot #matplotlib #dataanalysis #machinelearning #datavisualization #datascience
-
 0:16
0:16
AI Evolutionary Technology
1 month agoCreate Email Check Account Services Using Python
9 -
 15:48
15:48
GritsGG
14 hours agoWinning a Rare Solos Prison End Game on Warzone!
5.07K -
 11:37
11:37
The Pascal Show
14 hours ago $1.19 earnedTHEY WANT TO END HER?! Candace Owens Claims French President & First Lady Put A H*t Out On Her?!
4.88K4 -
 LIVE
LIVE
Lofi Girl
2 years agoSynthwave Radio 🌌 - beats to chill/game to
312 watching -
 24:30
24:30
DeVory Darkins
15 hours agoMarjorie Taylor Greene RESIGNS as Minnesota dealt MAJOR BLOW after fraud scheme exposed
70.8K118 -
 2:19:48
Badlands Media
1 day agoDevolution Power Hour Ep. 409: Panic in the Narrative — Epstein, Israel, and the Manufactured Meltdowns
161K56 -
 1:52:38
Man in America
12 hours agoCommunists VS Zionists & the Collapse of the American Empire w/ Michael Yon
69.9K39 -
 4:09:34
Akademiks
7 hours agoSheck Wes exposes Fake Industry. Future Not supportin his mans? D4VD had help w disposing his ex?
42.2K3 -
 6:43:43
SpartakusLIVE
11 hours agoTeam BUNGULATORS || From HUGE WZ DUBS to TOXIC ARC BETRAYALS
115K3 -
 2:44:56
BlackDiamondGunsandGear
7 hours agoAre You that guy? / Carrying a Pocket Pistol /After Hours Armory
27.1K1