Create a Funnel Chart in Python with Matplotlib Step by Step Guide
Create a Funnel Chart in Python with Matplotlib Step by Step Guide
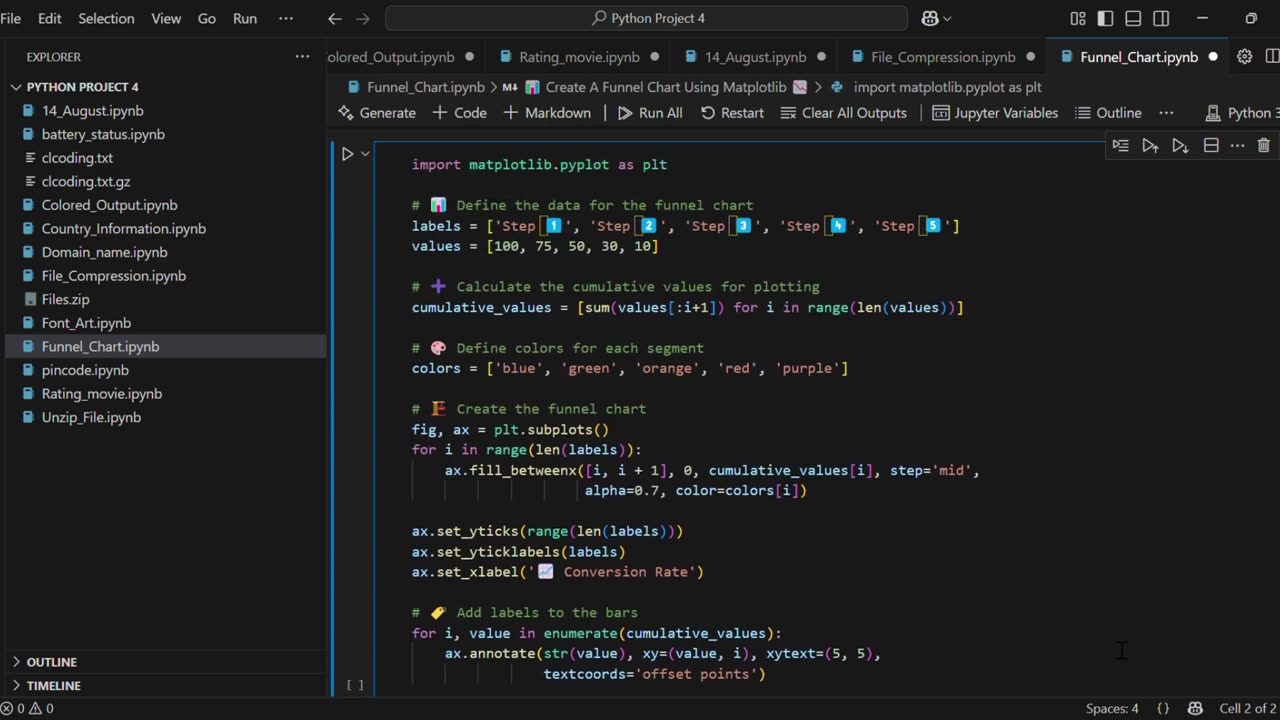
In this Python tutorial, you'll learn how to create a Funnel Chart step by step using the powerful Matplotlib library. Funnel charts are useful for visualizing processes like sales pipelines, user drop-off, and conversion rates in a simple and visual format.
📊 What You’ll Learn:
How to prepare data for a funnel chart
Creating a custom funnel chart using fill_betweenx()
Adding colors, labels, and formatting for clarity
Fixing common plotting errors in Matplotlib
📌 Perfect For:
Data Analysts
Python beginners
Students working on data visualization projects
💡 No extra libraries needed — just Matplotlib!
🔔 Subscribe for more Python data visualization tutorials.
#Python #programming #FunnelChart #codding #learnpython #pythonprogramming #scatterplot #matplotlib #dataanalysis #machinelearning #datavisualization #datascience
-
 0:17
0:17
AI Evolutionary Technology
1 month agoVisualizing Molecular Structure From SMILES Using RDKit 🧪
4 -
![GRAY ZONE DEVLOG FOR .3.5 UPDATE!!! [RGMT CONTENT Mgr. | RGMT GL | GZW CL]](https://1a-1791.com/video/fww1/11/s8/1/0/K/B/w/0KBwz.0kob-small-GRAY-ZONE-DEVLOG-FOR-.3.5-U.jpg) LIVE
LIVE
XDDX_HiTower
33 minutes agoGRAY ZONE DEVLOG FOR .3.5 UPDATE!!! [RGMT CONTENT Mgr. | RGMT GL | GZW CL]
53 watching -
 LIVE
LIVE
LFA TV
15 hours agoLIVE & BREAKING NEWS! | TUESDAY 11/4/25
3,965 watching -
 LIVE
LIVE
The Shannon Joy Show
1 hour agoICE Brutality In Evanston, Illinois Sparks New Outrage * GOP Seeks New FISA Re-Authorization * Are Tucker Carlson & Nick Fuentes Feds?
234 watching -
 LIVE
LIVE
The Mel K Show
1 hour agoA Republic if You Can Keep It-Americans Must Choose 11-04-25
534 watching -
 LIVE
LIVE
Grant Stinchfield
1 hour agoThe Mind Meltdown: Are COVID Shots Fueling America’s Cognitive Collapse?
143 watching -
 1:00:46
VINCE
4 hours agoThe Proof Is In The Emails | Episode 161 - 11/04/25
146K115 -
 2:12:22
Benny Johnson
3 hours ago🚨Trump Releases ALL Evidence Against James Comey in Nuclear Legal BOMBSHELL! It's DARK, US in SHOCK
77.7K26 -
 2:04:05
Badlands Media
11 hours agoBadlands Daily: November 4, 2025
58.6K8 -
 2:59:49
Wendy Bell Radio
7 hours agoBUSTED.
71.6K83