New Perspectives Excel 2019 | Module 8: End of Module Project 2 | Expo Events
Expo Events
EXPLORE BUSINESS OPTIONS WITH WHAT-IF TOOLS
GETTING STARTED
• Open the file NP_EX19_EOM8-2_FirstLastName_1.xlsx, available for download from the SAM website.
• Save the file as NP_EX19_EOM8-2_FirstLastName_2.xlsx by changing the “1” to a “2”.
o If you do not see the .xlsx file extension in the Save As dialog box, do not type it. The program will add the file extension for you automatically.
• With the file NP_EX19_EOM8-2_FirstLastName_2.xlsx still open, ensure that your first and last name is displayed in cell B6 of the Documentation sheet.
o If cell B6 does not display your name, delete the file and download a new copy from the SAM website.
PROJECT STEPS
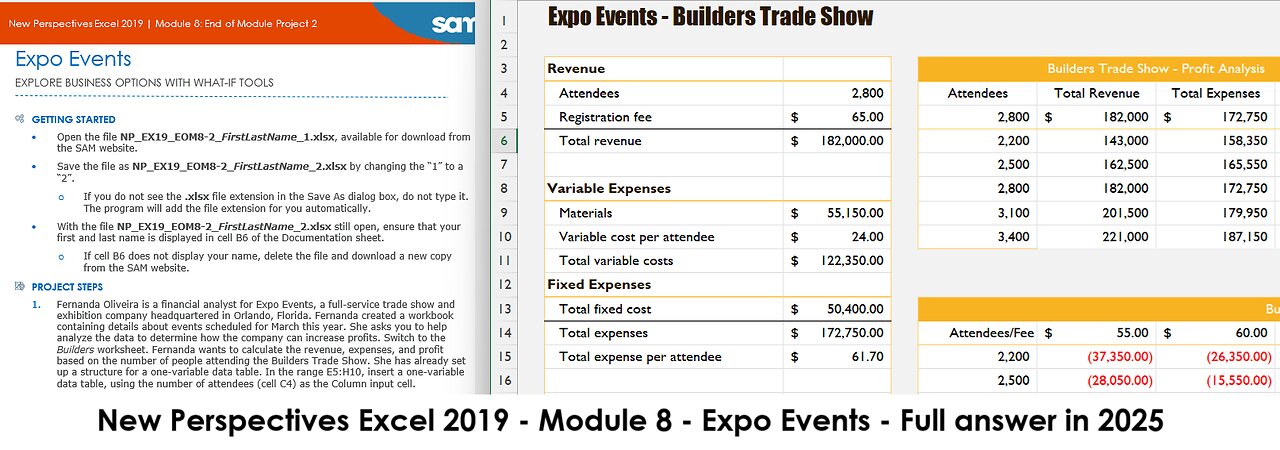
1. Fernanda Oliveira is a financial analyst for Expo Events, a full-service trade show and exhibition company headquartered in Orlando, Florida. Fernanda created a workbook containing details about events scheduled for March this year. She asks you to help analyze the data to determine how the company can increase profits. Switch to the Builders worksheet. Fernanda wants to calculate the revenue, expenses, and profit based on the number of people attending the Builders Trade Show. She has already set up a structure for a one-variable data table. In the range E5:H10, insert a one-variable data table, using the number of attendees (cell C4) as the Column input cell.
2. In cell E14, apply a custom format to display the text Attendees/Fee in place of the cell value.
3. Switch to the GymWear worksheet. Create a Scatter with Straight Lines chart based on the range E4:G14 in the data table titled GymWear - Break-Even Analysis. Resize and move the chart so that it covers the range E15:H27. Remove the chart title. Add Sales and Expenses as the vertical axis title and Attendees as the horizontal axis title.
4. Fernanda wants to change the bounds of the chart to better determine the break-even point. Change the Minimum Bounds of the vertical axis to 120,000 and let the Maximum Bounds change automatically to 210,000. Change the Number format of the vertical axis to Currency with 0 decimal places and $ as the symbol. Change the Minimum Bounds of the horizontal axis to 1,500 and let the Maximum Bounds change automatically to 2,500.
5. One way to increase profits is to run the GymWear trade show for an extra day. Another way is to add exhibits. Fernanda has already created a scenario named Extra Day and wants to create another for adding exhibits. In the Scenario Manager, add a scenario named using the data shown in bold in Table 1. The changing cells are the nonadjacent cells C4, C10, and C13.
Table 1: GymWear Scenario Values
Scenario Name Add Exhibits
Attendees (C4) 2200
Variable_cost_per_attendee (C10) 53
Total_fixed_cost (C13) 52,400
6. One of the values in the Extra Day scenario is incorrect. Edit the Extra Day scenario to use 55,000 as the Total_fixed_cost value. Show the Extra Day scenario, and then close the Scenario Manager.
7. Switch to the Logistics worksheet. Fernanda wants to clarify what each line means in the Scatter with Straight Lines chart in the range E15:J28. Edit the chart series names by using cell F5 as the series name for Series 1. For Series 2, use cell G5 as the series name. For Series 3, use cell H5 as the series name. For Series 4, use cell I5 as the series name. For Series 5, use cell J5 as the series name.
8. Switch to the Service Providers worksheet. Fernanda wants to determine whether partnering with other event services companies would reduce overall expenses for a trade show. Run Solver and set the objective as minimizing the total costs (cell F10). Use the hours provided for each company (range C4:E4) as the changing variable cells. Adjust the hours provided by each company using the following constraints:
· F4 is equal to 192, the total hours of event services provided.
· F10 is less than or equal to 48,000, the maximum amount Fernanda can pay to the other event services companies.
· C4:E4 is less than or equal to 68, the maximum hours provided by a single event services company.
· C4:E4 should be an Integer.
Run Solver, keep the solution, and then return to the Solver Parameters dialog box. Save the model to the range B14:B21.
9. Fernanda wants to document the answer Solver found, including the constraints and a list of the values Solver changed to solve the problem. Solve the model again, this time choosing to produce an Answer report. Use Services Answer Report as the name of the worksheet containing the Answer report.
10. Switch to the March worksheet, which compares the data for the three events the company is handling in March. Fernanda has created three scenarios on this worksheet to compare the current data with one that would increase registration fees and another that would increase expenses by using contractors. Use the Scenario Manager to create a Scenario Summary report that summarizes the effect of the Current, Increase Fee, and Contractors scenarios. Use the range C16:E16 as the result cells.
11. Switch back to the March worksheet. Use the Scenario Manager to create a Scenario PivotTable report for result cells C16:E16. Change the Number format of the value fields (Profit_Attendee_Builders, Profit_Attendee_GymWear, and Profit_Attendee_Logistics) to Currency with 2 decimal places and $ as the symbol.
12. Add a Clustered Column PivotChart to the Scenario PivotTable worksheet, based on the Scenario PivotTable report. Resize and reposition the chart so that it covers the range A8:C21.
Your workbook should look like the Final Figures on the following pages. Save your changes, close the workbook, and then exit Excel. Follow the directions on the SAM website to submit your completed project.
Final Figure 1: Builders Worksheet
Final Figure 2: GymWear Worksheet
Final Figure 3: Logistics Worksheet
Final Figure 4: Services Answer Report Worksheet
Final Figure 5: Service Providers Worksheet
Final Figure 6: Scenario Summary Worksheet
Final Figure 7: Scenario PivotTable Worksheet
Final Figure 8: March Worksheet
-
 39:01
39:01
Stephen Gardner
12 hours ago🔥This Will Leave You FURIOUS... What’s Really Going On?
38.4K83 -
 19:33
19:33
DeVory Darkins
14 hours ago $6.58 earnedBREAKING: Charlie Kirk's shooter in custody after making chilling confession
17.9K116 -
 2:12:43
TimcastIRL
8 hours agoErika Kirk Addresses Public After Charlie Kirk Assassination, Live Coverage | Timcast IRL
388K371 -
 30:59
30:59
The Charlie Kirk Show
7 hours agoCharlie Kirk's beloved wife, Mrs. Erika Kirk addresses the Nation.
542K1.51K -
 1:53:28
Man in America
15 hours agoLIVE: Assassin Arrested? Civil War? Are We Being Played?? | LET'S TALK
95.2K93 -
 2:10:33
Badlands Media
12 hours agoOnlyLands Ep. 24: Processing Tragedy, Cancel Culture, and the Next Spark
61.6K27 -
 2:27:53
TheSaltyCracker
8 hours agoGot Him ReeEEStream 9-12-25
275K344 -
 52:11
52:11
Sarah Westall
10 hours agoBread and Circus Keeps you Financially Ignorant – Its Better for the Elites w/ Chris Russo
66K8 -
 3:49:08
I_Came_With_Fire_Podcast
16 hours agoFriday Night Live Fire
57.4K6 -
 1:20:39
Flyover Conservatives
18 hours agoFrom Demonic Deception to Divine Direction: Sid Roth’s Radical Encounter With God | FOC Show
62K1