Premium Only Content

Deep Dive Update for Monday July 25, 2025
Link to The SPX Investing Program https://spxinvesting.substack.com
Link to The Daily Pivot Newsletter: https://thedailypivotnewsletter.substack.com/
Join to get access to perks:
https://www.youtube.com/channel/UCxlaGAKm2ApEs13O1gWDltg/join
Summary of the Deep Dive Video Update for July 28, 2025
This weekly video analyzes various market indicators and charts, some used in daily videos and others exclusive to this deep dive, to assess market trends and volatility for July 28, 2025. Key points include:
1. VIX and Volatility:
The Long-Term VIX (CBOE Volatility Index) is below 20 with a 50-period exponential moving average trending downward, indicating a lower-volatility environment and a generally positive market outlook.
VIX momentum (via MACD) and correlation with the S&P 500 show no significant signals, as daily volatility remains subdued.
The VVIX (volatility of the VIX) is declining, suggesting the VIX itself is less volatile.
The Ulcer Index, a sentiment gauge, is below its moving average and declining, indicating no immediate market stress.
2. Market Trends and Ratios:
Stocks vs. bonds volatility ratio is declining, which is positive in the current context.
Large caps are outperforming small caps, with small and mid-caps showing improving but no strong uptrend yet.
Momentum stocks show slight weakness compared to the S&P 500 since June, while U.S. stocks underperforming international markets in 2025.
3. Market Performance:
The S&P 500 is setting all-time highs, with a slight upward trend after a sideways period in late spring/summer.
Percentage gains from key lows (October 2022, October 2023, April 7, 2025) are tracked for context.
The S&P is above its 200-day moving average but not overextended (below the 10% threshold), suggesting potential for continued positive trends unless a decline begins.
4. Advance-Decline Lines:
The S&P and NYSE cumulative advance-decline lines are near all-time highs, with slight negative divergences in NYSE volume-based metrics, warranting monitoring.
Broad market participation is positive, but divergences could signal if larger stocks dominate.
5. Sector and Ratio Analysis:
Retail, transports, and regional banks show improvement but recent pullbacks; semiconductors and home builders also display minor weaknesses.
Gold and emerging markets underperforming the S&P 500, while European markets outperforming both.
Growth vs. value and discretionary vs. staples ratios are positive but recently underperforming, with tech outperforming utilities.
6. Bonds and Yields:
The 10-year to 3-month yield curve is slightly positive, not inverted, but lacks a clear trend.
TIPS (Treasury Inflation Protected Securities) ratios show inflation concerns have stalled, with a slight downtrend.
U.S. bonds underperforming Eurozone stocks, and the dollar shows an inverse relationship with yield spreads.
7. Technical Indicators:
Short-term (10-50 periods) and intermediate-term (50-100 periods) moving average rainbows are positive, with prices above all lines.
Long-term indicators (e.g., 250-period moving averages, weekly special K chart) remain positive.
The Ichimoku cloud is bullish, with prices above key lines and the cloud.
Point-and-figure charts show a recent ascending triple top breakout, and standard deviation metrics indicate no extreme movements.
8. Market Rankings:
NASDAQ leads with a score of 78.5, followed by QQQs (77.6), SPY (70.8), Dow (46.1), mid-caps (35.5), and small caps (32.7), indicating broader participation but weaker small/mid cap performance.
Technical alerts show a predominantly positive (green) outlook for the week.
9. Other Observations:
The NASDAQ outperforming NDX, suggesting broader participation but not exceptional strength.
The S&P 100 outperforming the S&P 500, indicating a solid market environment.
No significant signals from oscillators including the Connors RSI or the Mass Index on the daily chart, though a weekly Mass Index signal is noted but losing relevance.
Conclusion: The market is in a positive, low-volatility phase with the S&P 500 setting all-time highs. However, slight weaknesses in momentum stocks, small caps, and certain sectors (e.g., semiconductors, regional banks) suggest caution. Negative divergences in some advance-decline metrics and underperformance in growth vs. value ratios are worth monitoring, but no immediate red flags indicate a reversal. Objectivity should be used in technical analysis to avoid confirmation bias.
PDF of Slides:
https://drive.google.com/file/d/1xgE_hDw2FpOIp_5Q71A9w0IoaxYbhEex/view?usp=sharing
DISCLAIMER This video is for entertainment purposes only. I am not a financial adviser, and you should do your own research and go through your own thought process before investing in a position. Trading is risky!
-
 38:25
38:25
The SPX Investing Program
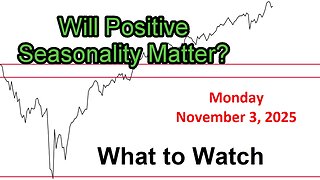
4 days agoWhat to Watch Update for Monday November 3, 2025
63 -
 LIVE
LIVE
Russell Brand
48 minutes agoTHE LEFT’S NEW STAR — What Zohran Mamdani’s Victory Really Means - SF647
9,968 watching -
 LIVE
LIVE
Dr Disrespect
5 hours ago🔴LIVE - DR DISRESPECT - ARC RAIDERS - AGAINST ALL DANGER
1,931 watching -
 1:40:36
The Quartering
2 hours agoKimmel Pulls Show Mysteriously, Youtube Collapse? & Much MOre
33.6K23 -
 LIVE
LIVE
The Robert Scott Bell Show
2 hours agoLive From CHD Austin Texas, Kids Triple Vaccinated, Blood Sugar and Autism, Candy Fed to Cows, Nutrition Reform - The RSB Show 11-7-25
132 watching -
 1:15:58
DeVory Darkins
2 hours agoLIVE NOW: Democrats SABOTAGE GOP effort to reopen Government
74.8K43 -
 1:21:21
Tucker Carlson
2 hours agoThe Global War on Christianity Just Got a Whole Lot Worse, and Ted Cruz Doesn’t Care
24.3K118 -
 10:50
10:50
Dr. Nick Zyrowski
2 days agoDoctors Got It Wrong! This LOWERS CORTISOL In Minutes!
2.97K2 -
 24:14
24:14
Verified Investing
2 days agoBiggest Trade As AI Bubble Begins To Burst, Bitcoin Flushes Through 100K And Gold Set To Fall
1.7K -
 1:12:28
Sean Unpaved
2 hours agoAB's Dubai Drama: Extradited & Exposed + NFL Week 10 Locks & CFB Week 11 Upsets
10.7K