New Perspectives Excel 365/2021 | Module 4: End of Module Project 2 | Tetra Sammander Insurance 2025
New Perspectives Excel 365/2021 | Module 4: End of Module Project 2
Tetra Sammander Insurance
ANALYZE AND CHART FINANCIAL DATA
GETTING STARTED
• Save the file NP_EX365_2021_EOM4-2_FirstLastName_1.xlsx as NP_EX365_2021_EOM4-2_FirstLastName_2.xlsx
o Edit the file name by changing “1” to “2”.
o If you do not see the .xlsx file extension, do not type it. The file extension will be added for you automatically.
• With the file NP_EX365_2021_EOM4-2_FirstLastName_2.xlsx open, ensure that your first and last name is displayed in cell B6 of the Documentation worksheet.
o If cell B6 does not display your name, delete the file and download a new copy.
PROJECT STEPS
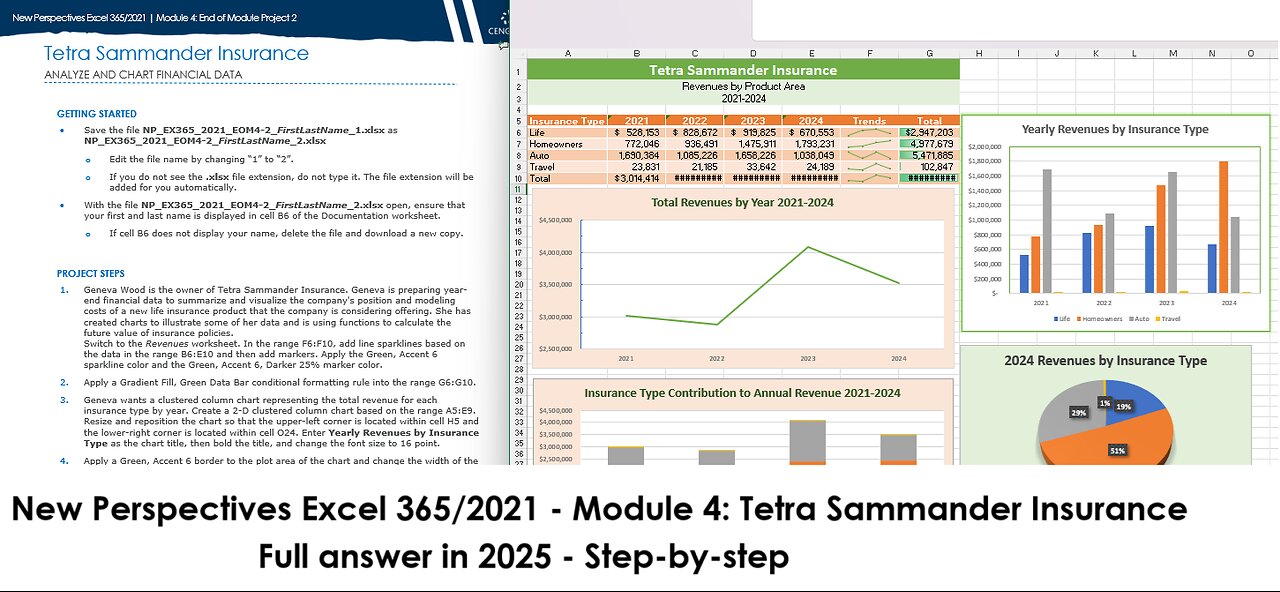
1. Geneva Wood is the owner of Tetra Sammander Insurance. Geneva is preparing year-end financial data to summarize and visualize the company's position and modeling costs of a new life insurance product that the company is considering offering. She has created charts to illustrate some of her data and is using functions to calculate the future value of insurance policies.
Switch to the Revenues worksheet. In the range F6:F10, add line sparklines based on the data in the range B6:E10 and then add markers. Apply the Green, Accent 6 sparkline color and the Green, Accent 6, Darker 25% marker color.
2. Apply a Gradient Fill, Green Data Bar conditional formatting rule into the range G6:G10.
3. Geneva wants a clustered column chart representing the total revenue for each insurance type by year. Create a 2-D clustered column chart based on the range A5:E9. Resize and reposition the chart so that the upper-left corner is located within cell H5 and the lower-right corner is located within cell O24. Enter Yearly Revenues by Insurance Type as the chart title, then bold the title, and change the font size to 16 point.
4. Apply a Green, Accent 6 border to the plot area of the chart and change the width of the border to 1.5 point. Apply a Glow Shape Effect to the chart area using 5 point Green, Accent Color 6.
5. In the 2024 Revenues by Insurance Type 3-D pie chart (in the range H26:O43), change the legend position to bottom. Add data labels that contain only percentages (not values) and that use the Center position.
6. In the Total Revenues by Year 2021-2024 line chart (in the range A11:G28), change the minimum bound of the vertical axis to 2500000, change the major units of the vertical axis to 500000 change the minor units to 250000, and then add Inside tick marks for the minor units on the vertical axis.
7. Apply a solid fill using the Orange, Accent 2, Lighter 80% fill color to the chart area. Apply the Green, Accent 6, Darker 50% font color to the chart title, and change the font to 16 point bold. Apply the Green, Accent 6 color to the data line, and change the width to 2.25 point.
8. In the Insurance Type Contribution to Annual Revenue 2021-2024 stacked column chart (in the range A29:G46), remove the data series labeled Trends from the chart. Apply a Shape Fill to the chart area using the Orange, Accent 2, Lighter 80% fill color. Apply a Solid Line border to the chart area with a White, Background 1, Darker 35% border color.
9. Create a 2-D Column chart based on the range A5:E10. Move the 2-D Column chart to the Revenue Summary worksheet, and then resize and reposition the chart so the upper-left corner is located within cell A5 and the lower-right corner is located within cell K22. Select Switch Row/Column to edit the chart data source. Change the chart type to create a Custom Combination Combo chart. Represent the following data series as a Clustered Column chart: Life, Homeowners, Auto, and Travel, and represent the Total data series as a Line chart using the Secondary Axis. [Mac hint - Keep the main chart a Clustered Column chart, select the Total data series, change the chart type to a Line chart, and plot the series on the Secondary Axis.]
10. Enter Policy Type and Total Yearly Revenue as the chart title. Add axis titles to the chart, enter Revenue by Policy Type as the left vertical axis title, and then enter Total Revenue as the right vertical axis title. [Mac hint - Add Primary Vertical and Secondary Vertical Axis titles.] Delete the horizontal axis title placeholder, if necessary.
11. Switch to the Payments worksheet, select the range A6:B156 and create a Histogram chart. Resize and reposition the chart so that the upper-left corner is located within cell D5 and the lower-right corner is located within cell N23.
12. For the horizontal axis, change the bin width to 250, add an overflow bin with a value of 1500, and change the number format to the Currency number format with decimal places to 0. Enter Distribution of Payout Amount per Policy in 2024 as the title of the chart, and format the chart title using bold.
Your workbook should look like the Final Figures on the following pages. Save your changes, close the workbook, and then exit Excel. Follow the directions on the website to submit your completed project.
Final Figure 1: Revenues Worksheet
Microsoft product screenshot reprinted with permission from Microsoft Incorporated. Copyright © 2020 Cengage Learning. All Rights Reserved.
Final Figure 2: Revenue Summary Worksheet
Final Figure 3: Payments Worksheet
-
 LIVE
LIVE
Rebel News
48 minutes agoLibs 'monitoring' trans law, Quebec tax hoarding, Ford says 'look harder' | Buffalo Roundtable
289 watching -
 LIVE
LIVE
Badlands Media
1 hour agoThe Daily Herold: Sept. 10, 2025
1,400 watching -
 1:06:13
The Rubin Report
2 hours agoPress Gasps When Told Trump’s Brutal Plan for Charlotte Stabbing Suspect
20.6K45 -
 LIVE
LIVE
The Mel K Show
2 hours agoMORNINGS WITH MEL K - Preparing for the Truth Tsunami: Can We Handle the Truth? 9-10-25
880 watching -
 1:35:20
Benny Johnson
3 hours agoBlack on White Crime Epidemic EXPOSED After Charlotte Murder | Trump Calls for 'DEATH PENALTY'
34.3K132 -
 DVR
DVR
Bannons War Room
6 months agoWarRoom Live
35.1M8.23K -
 LIVE
LIVE
The Shannon Joy Show
4 hours agoThe Truth Is Coming Out About Vaccine Death. Ron Johnson’s Bombshell Hearing & Courtaney Turner!
288 watching -
 1:00:35
VINCE
4 hours agoBiden Jobs Reports Were Found Fake, AGAIN | Episode 122 - 09/10/25
165K312 -
 LIVE
LIVE
LFA TV
7 hours agoLFA TV ALL DAY STREAM - WEDNESDAY 9/10/25
4,153 watching -
 1:34:57
Caleb Hammer
5 hours agoMy Lawyer Had To Step In | Financial Audit
14.2K4