New Perspectives Excel 2019 | Module 7: End of Module Project 1 | Pierce Software (Update 2025)
Pierce Software
SUMMARIZE DATA WITH PIVOTTABLES
GETTING STARTED
• Open the file NP_EX19_EOM7-1_FirstLastName_1.xlsx, available for download from the SAM website.
• Save the file as NP_EX19_EOM7-1_FirstLastName_2.xlsx by changing the “1” to a “2”.
o If you do not see the .xlsx file extension in the Save As dialog box, do not type it. The program will add the file extension for you automatically.
• With the file NP_EX19_EOM7-1_FirstLastName_2.xlsx still open, ensure that your first and last name is displayed in cell B6 of the Documentation sheet.
o If cell B6 does not display your name, delete the file and download a new copy from the SAM website.
PROJECT STEPS
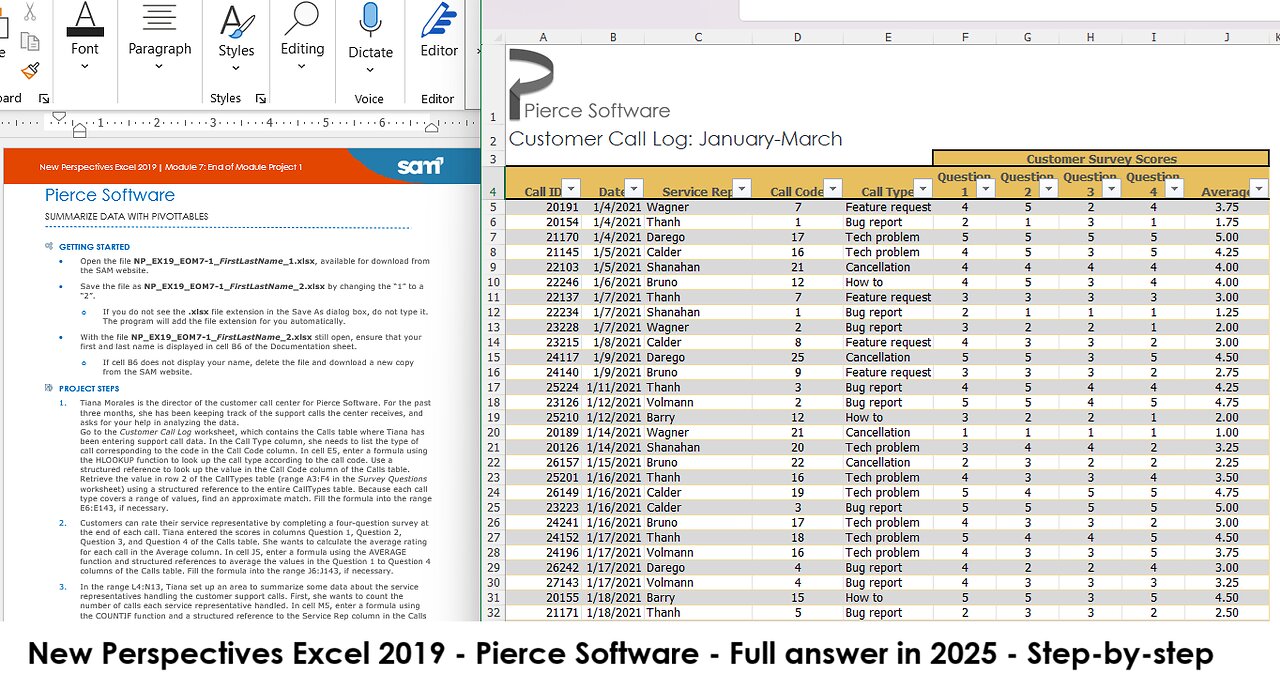
1. Tiana Morales is the director of the customer call center for Pierce Software. For the past three months, she has been keeping track of the support calls the center receives, and asks for your help in analyzing the data.
Go to the Customer Call Log worksheet, which contains the Calls table where Tiana has been entering support call data. In the Call Type column, she needs to list the type of call corresponding to the code in the Call Code column. In cell E5, enter a formula using the HLOOKUP function to look up the call type according to the call code. Use a structured reference to look up the value in the Call Code column of the Calls table. Retrieve the value in row 2 of the CallTypes table (range A3:F4 in the Survey Questions worksheet) using a structured reference to the entire CallTypes table. Because each call type covers a range of values, find an approximate match. Fill the formula into the range E6:E143, if necessary.
2. Customers can rate their service representative by completing a four-question survey at the end of each call. Tiana entered the scores in columns Question 1, Question 2, Question 3, and Question 4 of the Calls table. She wants to calculate the average rating for each call in the Average column. In cell J5, enter a formula using the AVERAGE function and structured references to average the values in the Question 1 to Question 4 columns of the Calls table. Fill the formula into the range J6:J143, if necessary.
3. In the range L4:N13, Tiana set up an area to summarize some data about the service representatives handling the customer support calls. First, she wants to count the number of calls each service representative handled. In cell M5, enter a formula using the COUNTIF function and a structured reference to the Service Rep column in the Calls table to count the number of calls Barry (cell L5) handled. Fill the formula into the range M6:M13 without formatting.
4. Tiana also wants to average the combined scores for each employee. In cell N5, enter a formula using the AVERAGEIF function and structured references to the Service Rep and Average columns in the Calls table to average the scores Barry (cell L5) received for all the calls he handled. Fill the formula into the range N6:N13 without formatting.
5. Go to the Call Type by Rep worksheet. Tiana wants to compare the call data by type for each service rep. In cell A3, insert a PivotTable based on the Calls table. Use RepCalls as the name of the PivotTable. Display the service rep names as column headings, and the call types as both row headings and values.
6. Apply Light Yellow, Pivot Style Medium 12 to the PivotTable to coordinate with the table on the Customer Call Log worksheet. Center the data in the range B4:K10 to make it easier to read.
7. Tiana notices that Service Rep Bruno has no calls in the How to category, which she knows is incorrect. Return to the Customer Call Log worksheet, and then change the Call Code in cell D10 to 12, which assigns a call to Bruno in the How to category. Go to the Call Type by Rep worksheet and refresh the data in the PivotTable.
8. Go to the Scores by Date worksheet. In cell A3, insert another PivotTable based on the Calls table. Use Scores as the name of the PivotTable. Display the Date values as column headings, which automatically groups the data by month. Display the Service Rep names as row headings and the Average score data as values.
9. Change the summary function to Average for the data in the Values area and apply the Number number format with 2 decimal places to those values.
10. In cell A3, use the text Average Scores to identify the values. In cell B3, use the text Months to identify the column headings. In cell A5, use the text Service Reps to identify the row headings. Apply Light Yellow, Pivot Style Medium 12 to the PivotTable to match the other PivotTable.
11. Tiana wants to focus on scores for calls involving technical problems in February. Create a slicer for the Scores PivotTable based on the Call Type field. Resize the slicer to a height of 2.5". Move the slicer so its upper-left corner is in cell F3 and its lower-right corner is in cell G14. Use the slicer to filter the Scores PivotTable by the Tech problem call type.
12. Create a timeline slicer based on the Date field in the Scores PivotTable. Resize the timeline slicer to a width of 7". Move the slicer so that its upper-left corner appears within cell A16 and its lower-right corner appears in cell G23. Use the timeline slicer to show data for February only.
13. Resize columns B:C to 12.00 and center the data in the range B3:C15.
Your workbook should look like the Final Figures on the following pages. Save your changes, close the workbook, and then exit Excel. Follow the directions on the SAM website to submit your completed project.
Final Figure 1: Customer Call Log Worksheet
Final Figure 2: Call Type by Rep Worksheet
Final Figure 3: Scores by Date Worksheet
Final Figure 4: Survey Questions Worksheet
-
 20:19
20:19
RiftTV
21 hours agoKash Patel's GF Is Suing MAGA Influencers for Jokes & Memes | Amy Dangerfield
7.54K19 -
 LIVE
LIVE
StuffCentral
3 hours agoRest here with Stuffy
40 watching -
 LIVE
LIVE
Reidboyy
13 hours ago24/7 BO7 Camo Grind! Stream Doesn't End Until I Unlock EVERY Camo in Black Ops 7!
45 watching -
 23:46
23:46
iCkEdMeL
1 hour ago $1.18 earned🔴 Anna Kepner Case: 3AM Warning and Cabin Screaming Reveal Terrifying Timeline
2.36K -
 LIVE
LIVE
HomieQuest
4 hours agoLive Streaming!
61 watching -
 26:47
26:47
Degenerate Jay
5 hours ago $2.51 earnedPlaying Fallout 3 For The First Time Ever - Here's My Thoughts
12.6K3 -
 LIVE
LIVE
ItsMossy
1 hour ago🍃DEVS ARE CRACKING DOWN🍃maybe a video?🍃shrooms aren't real dude🍃ARC RAIDERS RAIDERING SO HARD🍃
33 watching -
 59:25
59:25
Jeff Ahern
3 hours ago $9.74 earnedThe Saturday Show with Jeff Ahern
75.7K16 -
 29:53
29:53
Afshin Rattansi's Going Underground
2 days agoBRICS MUST Replace the US’ Authoritarian International Financial System! (Prof. Steve Keen)
10.3K16 -
 31:27
31:27
Robbi On The Record
3 days ago $11.40 earnedWhat the Bible say about Astrology.. The Conversation Culture Has Been Avoiding | ft. JT Follows JC
44.9K12