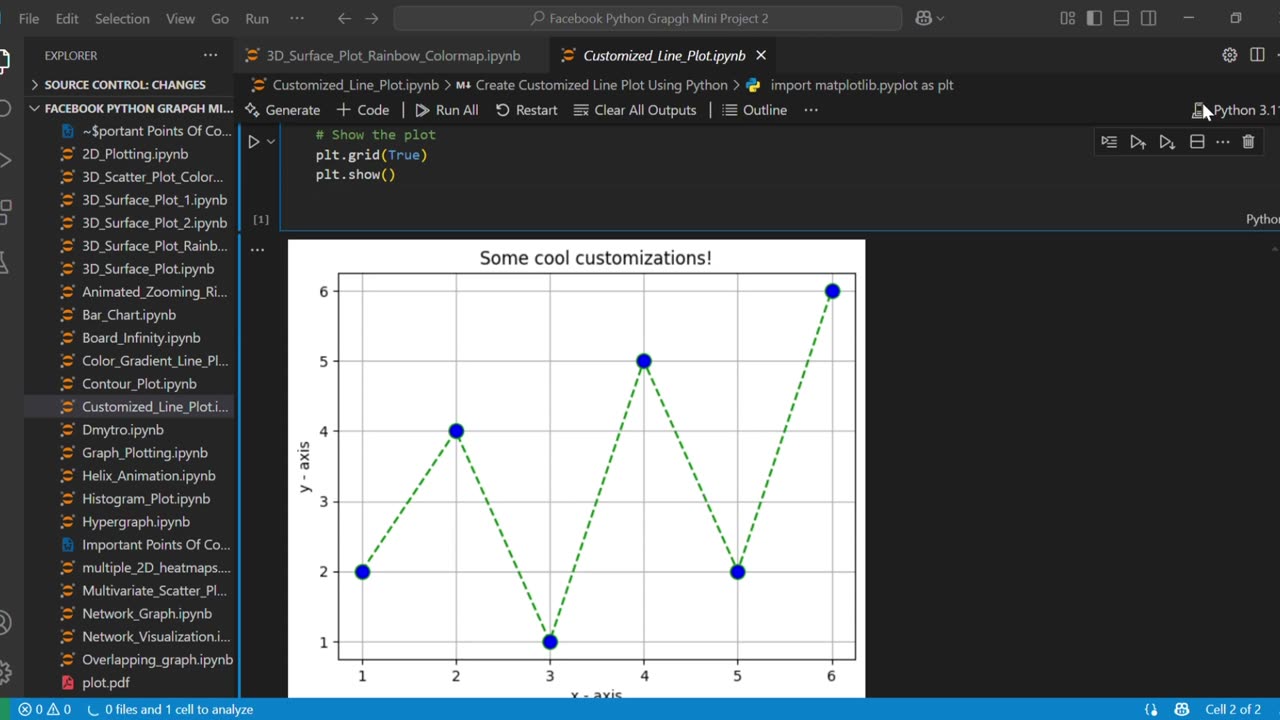
Create Customized Line Plot Using Python
How to Create Publication-Quality Plots in Python | Step-by-Step Tutorial
Struggling to make your Python plots look professional enough for papers or presentations? In this tutorial, I’ll show you exactly how to create polished, publication-ready visualizations using Matplotlib – no design skills required!
Github Link:https://github.com/nazishjaveed/Pytho...
🔍 You’ll Learn How To:
✅ Transform basic plots into journal-ready figures
✅ Customize colors, markers, and line styles like a pro
✅ Perfect your axes, labels, and fonts for readability
✅ Add grids and annotations for clarity
✅ Export high-resolution images (PNG, PDF, SVG)
💬 Let’s Connect!
🔔 Subscribe for more data science tutorials
👍 Like if you found this helpful
💬 Comment – What plot style should I cover next?
#Python #DataVisualization #Matplotlib #AcademicWriting #Research #DataScience #PythonTutorial #ScientificVisualization #Plotting #LearnPython #programming #Coding #STEM #DataAnalysis #techtutorial
-
 0:52
0:52
AI Evolutionary Technology
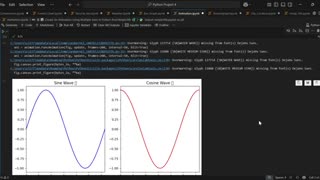
7 days agoCreate Synchronized Multi-Plot Animations in Python
91 -
 7:49
7:49
Talk Nerdy Sports - The Ultimate Sports Betting Podcast
3 hours agoTNF BEST BETS: Eagles vs Cowboys | 10 Props & Same-Game Parlays (Sept 4, 2025)
7 -
 LIVE
LIVE
Anthony Rogers
3 hours agoProbably the best Fortnite stream
38 watching -
 47:48
47:48
The White House
6 hours agoFirst Lady Melania Trump Hosts a Meeting of the White House Task Force on AI Education
15.3K26 -
 1:27:12
Sean Unpaved
2 hours agoThursday Night Thrills & Kawhi's No-Show Gig in LA
13K1 -
 43:58
43:58
Members Club
2 hours ago $0.16 earnedTrump Death Hoax, Labor Day Fashion, and the Year of the Cursed CEO - MC08
3.37K4 -
 LIVE
LIVE
StoneMountain64
2 hours agoTOP GHILLIE SNIPERS play Warzone's NEW UPDATE
108 watching -
 LIVE
LIVE
Reidboyy
2 hours ago $0.20 earnedHow To Make $$$ in Delta Force Console Operations!
28 watching -
 1:00:35
Timcast
3 hours agoDOJ To BAN Transgenders From Owning Guns
124K139 -
 2:11:25
Side Scrollers Podcast
4 hours agoUK JAILS TV WRITER FOR WRONG THINK + TWITCH ALLOWS CYBERSTALKING + MORE | SIDE SCROLLERS LIVE
13K