USING MICROSOFT EXCEL 2016 - Independent Project 8-5 - Placer Hills Real Estate (Full answer 2025)
USING MICROSOFT EXCEL 2016
Independent Project 8-5
Independent Project 8 5
At Placer Hills Real Estate, the commission and fee split between the listing and selling agents depends on price
tiers (levels). You create a one-variable data table to display commissions and net earnings for various split rates.
You copy the sheet and edit it to show results for another price tier. Additionally, you create scenarios for selling
price and commission, generate summary statistics, and create a forecast sheet.
Skills Covered in This Project
• Build a one variable data table.
• Use Solver.
• Create and manage scenarios.
• Generate descriptive statistics.
• Create a forecast sheet.
Step 1:
Download
start file
1.
2.
3.
Open the PlacerHills-08 workbook and click the Enable Editing button. The file will be renamed
automatically to include your name.
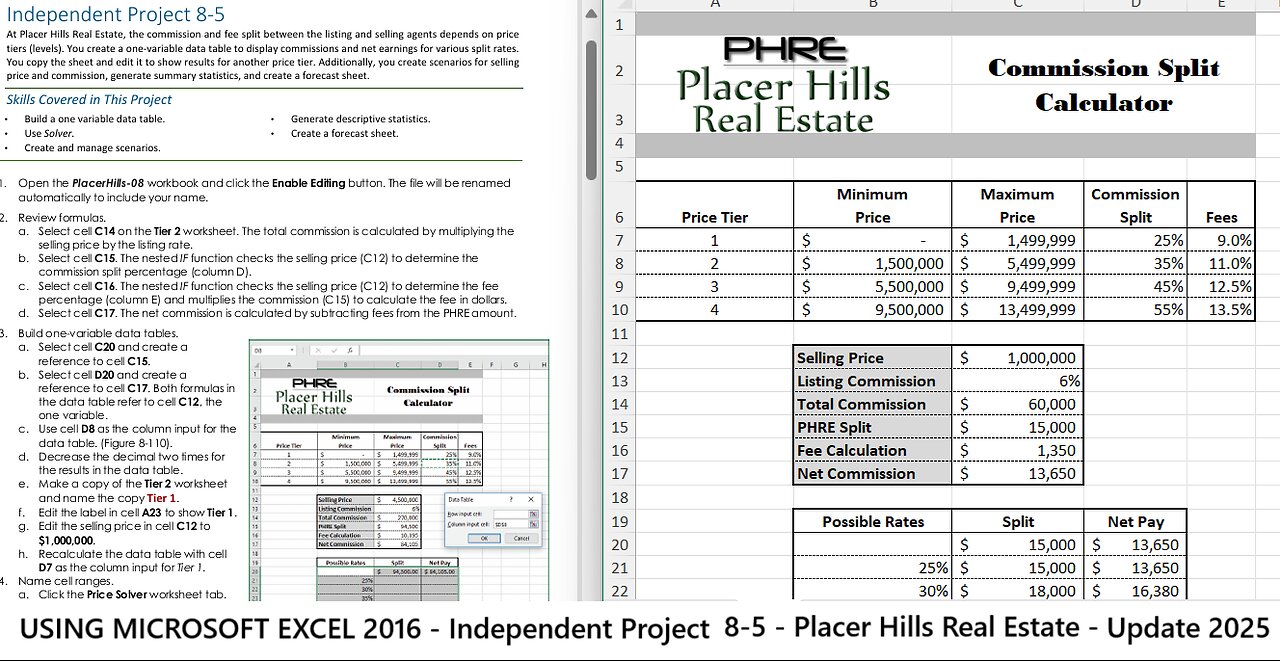
Review formulas.
a. Select cell C14 on the Tier 2 worksheet. The total commission is calculated by multiplying the
selling price by the listing rate.
b. Select cell C15. The nested IF function checks the selling price (C12) to determine the
commission split percentage (column D).
c. Select cell C16. The nested IF function checks the selling price (C12) to determine the fee
percentage (column E) and multiplies the commission (C15) to calculate the fee in dollars.
d. Select cell C17. The net commission is calculated by subtracting fees from the PHRE amount.
Build one-variable data tables.
a. Select cell C20 and create a
reference to cell C15.
b. Select cell D20 and create a
reference to cell C17. Both formulas in
the data table refer to cell C12, the
one variable.
D8
1
.
A
><
fx
B
C
D
E
I
I
F
I
G
Fat IRE:
2
3
4
5
c. Use cell D8 as the column input for the
data table. (Figure 8-110).
d. Decrease the decimal two times for
the results in the data table.
e. Make a copy of the Tier 2 worksheet
and name the copy Tier 1.
f.
Edit the label in cell A23 to show Tier 1.
g. Edit the selling price in cell C12 to
$1,000,000.
h.
4.
Recalculate the data table with cell
D7 as the column input for Tier 1.
Name cell ranges.
a. Click the Price Solver worksheet tab.
b. Click cell C12 and name the range
Selling_Price. You cannot use spaces
in a range name.
c. Name cell C14 as Total_Commission
and cell C17 as PHRE_Commission.
0
7
8
9
10
11
li
li_
li
'i
,~
17
18
19
20
21
21
2l
24
25
26
21
28
29
Placer Hills
Real E_sta
Minimum
Price Tier
1
2
3
4
Tier 2
s
_ S -------- 1,500,000 __ $
s
s
Selling Price
~~!~~e Commission
Total Commission
PHRESplit
Fee Calculation
Net Commission
Possible Rates
CoDllll.is .. ion Split
Calculator
e
P1lce
Maximum
Price
s
Commi~ion
Split
1,499,999 ~----- 25~)
5,499,999 I
Fees
9.0%
J51 r-_ 11.0%
5,500,000 s
9,500,000 $
s
s
9,499,999
13,499,999
4,500,000
6%
45% 12.5%
55%
13.5%
Data Table
I
I
Bow input cell:
270,000
$
s
s
94,500
10,39.5
~olumn input cell:
?
I
I SOSO
DO Ca~
84,105
Solit
$
Net Pav
94,500.00 $84,105.00
2.5%
30%
35%
40%
45%
50%
55%
60%
I
X
1 ,l!jl
lrtij l
H
8-110 Data table setup for Tier 2
5.
6.
Install the Solver Add-in and the Analysis
ToolPak.
Use Solver to find target PHRE net commission amounts.
a. Build a Solver problem with cell C17 as the objective cell. For the first solution, set the objective
to a value of 50000 by changing cell C12. Save the results as a scenario named $50,000.
Excel 2016 Chapter 8 Exploring Data Analysis and Business Intelligence
Last Updated: 12/29/17 Page 1
Excel 2016 Chapter 8 Exploring Data Analysis and Business Intelligence Last Updated: 12/29/17 Page 2
Sale Price
IMean
Standard Error
Median
Mode
Standard Deviation
Sample Variance
Kurtosis
Skewness
Range
Minimum
Maximum
Sum
Count
Largest(!)
Smallest(!)
1370593.2
19986.61
365000
#N/A
93745.5
8.79E-t-09 -1.23251
0.01939
294100
228900
523000
8153050
22
523000
228900
USING MICROSOFT EXCEL 2016 Independent Project 8 5
8-111 Descriptive statistics for sales
Step 3:
Grade my
Project
Step 2:
Upload &
Save
b. Restore the original values and run another Solver problem to find a selling price for a PHRE
commission of 75000. Save these results as a scenario named $75,000.
c. Restore the original values and run a third Solver problem to find a selling price for a net
commission of $100,000. Save these results as a
scenario.
7. Manage scenarios.
a. Show the $50,000 scenario in the worksheet.
b. Create a Scenario summary report for cells C12, C14,
and C17.
8. Generate Descriptive Statistics for recent sales.
a. Click the Sales Forecast sheet tab.
b. Generate Descriptive Statistics for cells E4:E26 and note
that the label is in the first row.
c. Select the Output Range button, click the entry box,
and select cell G4.
d. Select the Summary statistics box and include the
largest and smallest (Kth values) in the report.
e. AutoFit column G (Figure 8-111).
9. Create a forecast sheet for the date and price data on the
Sales Forecast sheet using a column chart. End the forecast
three months from the last date in the table. Position the
chart object with its top-left corner in cell E1. Size the chart
object to reach cell P20. Name the generated sheet as
Forecast.
10. Save and close the workbook (Figure 8-112).
11. Upload and save your project file.
12. Submit project for grading.
Prri<:e-Tler
Commissle• Split
C..lelllator
Minimu-m l\ta>imum CommiHion
Price Price Spilt Fes
_ _:.. __ -+-" S _____ +cc_-"V199,999 -··-·-· zs,·;u __ 9.Ml --'----+""s __ -= uoo.ooo_ s ··-· s.499.m _ .. _,_ , s~l!I _ ,11.M; --"----+-',---?',5 ,500,00J. S ----9,499,999 ---- ·-· .!...5-~ _ _ ll.5~
9,500,000 S 13,499,999 55~ 13-.5'~
Tier 1
Scllin1.Price ·-·-··-5 ·-·· 1,000,000.
Usti:n1.Commis.s.ion __ -·-··-·-·-· 6~
rotal commls!!.lon S 60,000
PHII.E Sp lh $ 15,000
J:~~~~~~--$ 1,350
Ne1 Comm lsdo n S 13,650
Pou:lble R.ate-.s Spllr NerPay -----------------15,0CO S 13,650
25:>I 15,000 S U,650
_____________ 30:>I S ____ ...,1,=B,""OOO =--if-'Scc__,1'-=6~ ,380 =-i
., _____ ., ____ 35ll S __ ., __ 21,000 S 19,110
., _____ ., ____ 409I 5 __ ., __ 24,000 S _ .. 21.S\O
., _____ ., ____ 45ll 5 __ ., __ 2?,000 5_ .. 2~70
SO% $ 30,00J $ 21,300
55ll S 33,000 S 30,000
60ll 5 36,000 $ 32,760
2{',-U ~~&,'!DO
lf1Af»1E-S,IA.S,(DQ
l,121(»16 iU7,(ll0
l,f'J~Ui Sl~mo
3/61»1& iHQ.<DO
J/H/a:n.li ~namo
inO/X>U SZ'5;'!00
J/H/1Dlli sn1,mo
4f3(1DJJi SJ]!t,(DCI ~,,1,,<DC
'i/H/1DlJi S4l5.ro0
~1fi.S§05.,!ir!IO
S,,(»16 SMO.CDO
5J8r.(IU S-C-'0,<00
._,15,'»1& 5'25.CDO
i/lJ/lCU SJ1Q.<DO
v.:l!t/»1& m.uoo
&/'5(1DJJi S50Q.ro0
f/ll(lo~
,...,,,r.,o
r,'l!t(1DJJi 5-475,(DCI
.,,.,... ..... CDC
'1{3/){J1E-51911,,<DO ,,,,,,,.,.
1/11(1/JU
'l''f'OU
7/3l/lDU "",.,,. ''"'""' .,,.,.,,. -l/l8{l(IU
OJ/4(1Dl.li
"'11,"lCU .,,.,,..,Ii
1/,25/lDl.li
"'/'/Dli
"'11•»<
_,,, $1Jl.,63,I
$-'9*.,9ol0 S1E.]l9 , ... .,., Sl.:l,05!,
SSJS,.617 S1C)l1
'"'JW6 Sl«l,S.11
S!a6)113 S1~,:!51
SSoifi.)81. S143J)l1
SSS1,.14' S1El)3£
SW.511 Sl44,s66 ,.,,..,. 5145.353
SSlll,ZS4 Sl4i.J51
ssae,.&zz Sl"l:i.9§9 --$1"'1,H7
,.,..,. 5113-.3851
Scenario Summary
Chin.sins Cells;
selll~Prke
Reoult Cells:
Selling_Price
Total_Commis.sion
PH RE cornml..ion
Prl{:ener
Commis.sio• Split
Caleulator staL.__ _________ ----.
Mt11imum
Price
Ma>Grnum Commi5-Sion
Price Spl tr Jees
I S ---1-c--~l.~Joc ,9cc~=. '-r---"' ==+--.. t~ ________ 2 ________ s ________ 1,~ooo s ____ Ji499.L999 35% __ t!-.~
3 S 5,500,000 $ 9,d.99_.'99-~ t::5% 12.5%
4 S 9,500,000 $ B,499,'m 5~ --il5%
Sellin,1 Prire ________ t--s ____ ~,50~000
Lktl.ngCamm~lon 6%
t.i: ~m~sKXl
:=::S=:=:= 2~~~=
Fee Calc:Ul!a1lon $ 10,395.
Net Commi~,ion "$ 84,105
Possible Rat!'.5-Sp{it I.Jet Pay
25li
94,S.OO S. 84,105
~--5=1=.;oo=""'""s 60.01s
Tier 2
______________ 303' ,j -----~B~ l ~ooo =t~•-~7~2~090 4
,_ _____ ,_s"-+-S __ ..:: •...:••c:. ' '"' ~ ...:>c_...:•:.:•cc• 1ccaec,
40% S 108.000 S 96,120 --------------4591 $ 121,500 S 108,135
______________ 503' ,j _____ __,13= 5 ,,,ooo"'+--' s~ 1,,2,,o""is"o'"
55% S 146,500 S 151,165
60* '$ 162,000 S 144,180
1111111111
(ur~r.rVr:Ju~ S':-0000 $15001 $10001))
2,616,431 2,616,431 s 3,924,647 5,232,862
2,616,431 2,616,431 s 3,92A,647 5.232,862
156,986 156,986 235,179 313,972
50,000 50,000 s 75,000 100,000
Notes; CU-rent Values column represents values of c:1-Ens.-is cells at
tme SCenarloSumffi3ry Report was created. Ch:mgillg eels for mch
>eenono arehlgl,~ghted r>gray.
USING MICROSOFT EXCEL 2016 Independent Project 8 5
Excel 2016 Chapter 8 Exploring Data Analysis and Business Intelligence Last Updated: 12/29/17 Page 3
8-112 Completed worksheets for Excel 8-5
-
 1:09:23
The HotSeat
14 hours agoTrump’s Parade = Mocked, China’s Parade = Praised: Leftist Hypocrisy EXPOSED
35K33 -
 LIVE
LIVE
Lofi Girl
2 years agoSynthwave Radio 🌌 - beats to chill/game to
193 watching -
 4:34:26
Akademiks
8 hours agoICEMAN EPISODE 3
157K -
 2:04:10
Inverted World Live
10 hours agoThe Robots Are Here | Ep. 103
68.8K16 -
 1:21:53
Man in America
18 hours agoInflation, Debt & War: The 2032 Crash Cycle Is Here—Nations Will FALL w/ Martin Armstrong
70.3K21 -
 1:53:48
Adam Does Movies
17 hours ago $5.38 earnedTalking Movies + Ask Me Anything - LIVE
30.5K3 -
 2:55:43
TimcastIRL
9 hours agoTrump DOJ To Ban Trans People From Owning Guns After Catholic School Shooting | Timcast IRL
196K128 -
 3:21:36
The Quartering
9 hours agoBaldur's Gate 3 First Playthrough!
53.7K8 -
 6:34:42
Rallied
11 hours ago $11.55 earnedWarzone Solo Challenges
82.8K2 -
 57:40
57:40
MattMorseTV
10 hours ago $12.60 earned🔴Trump just SHATTERED the RECORD.🔴
59.3K100