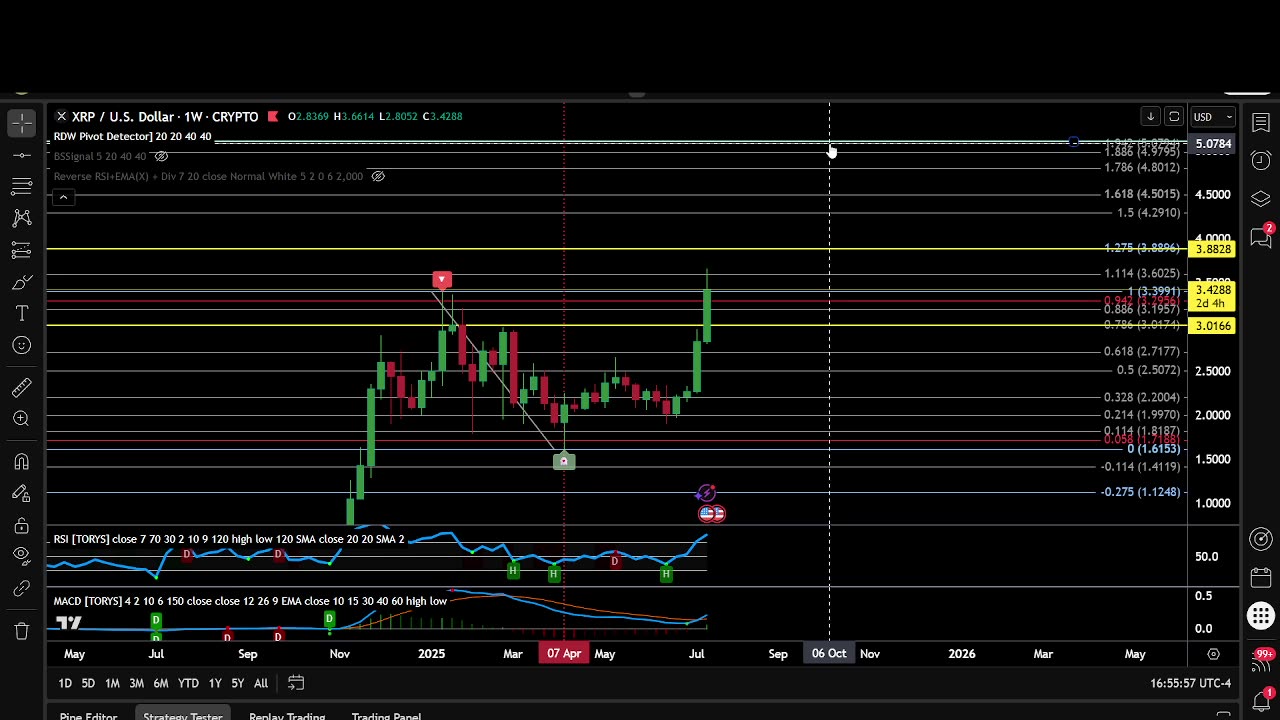
XRP ANALYSIS $5?
OOOPss, I am not technical trade advisor of any kind, just showing you how i trade!!!! Stringent Technical Breakdown:
1. Price Structure & Momentum:
Parabolic:
The rise from sub-$2 to $3.40+ is near-vertical, typically unsustainable over longer periods.
RSI:
Almost certainly overbought (>80 on daily/weekly), signaling high risk of near-term correction.
MACD:
Strong bullish cross, but sharp peaks often precede reversals.
2. Support/Resistance:
Support:
$3.00 (recent breakout), $2.50 (prior top), $2.00 (macro level)
Resistance:
$3.50 (minor psychological), $3.84 (historical ATH), $5.00 (next extension)
Any failure to hold $3.00 likely triggers deeper correction.
3. Volume & Pattern:
Likely record volumes, but “blow-off” moves are often accompanied by climax volume.
Watch for signs of distribution: massive wicks, sharp intraday reversals, or persistent selling into strength.
4. Narrative & Risk:
Parabolic moves always look unstoppable at the top.
At new all-time highs, technicals are less predictive; crowd psychology and liquidity rule.
Altcoin tops historically occur after (not before) BTC/ETH top out for the cycle.
Critical Meta-Reflection:
The higher and faster price rises, the greater the risk of a “rug pull” or brutal mean-reversion.
Many traders and investors will buy near the top, driven by FOMO.
Only consider new entries with a strict plan: trailing stops, defined risk, and willingness to exit quickly.
Synthesis & Conclusion:
Technically:
XRP is in a historic breakout. Momentum is strong, but almost certainly unsustainable at this rate.
Probability:
Further upside to $3.84–$5.00 possible, but risk of a sharp correction is extremely high. Most “new highs” moves retrace 30–60% before consolidating or continuing higher.
-
 2:18:53
Badlands Media
19 hours agoDevolution Power Hour Ep. 403: Brennan Exposed & The Intel War w/ Thomas Speciale
444K112 -
 4:34
4:34
Legal Money Moves
5 days agoThe AI Panic: Are You Next?
26.7K10 -
 25:41
25:41
Robbi On The Record
2 days ago $42.47 earnedThe Billion-Dollar Lie Behind OnlyFans “Empowerment” (Her Testimony Will Shock You) | part II
60.9K66 -
 1:06:09
Man in America
20 hours agoExposing HAARP's Diabolical Mind Control Tech w/ Leigh Dundas
88.7K94 -
 1:47:16
Tundra Tactical
16 hours ago $115.93 earnedGlock Interview From Beyond The Grave//Whats the Future of Home Training??
69.9K12 -
 2:16:35
BlackDiamondGunsandGear
15 hours agoEBT Apocalypse? / Snap Down SHTF / After Hours Armory
41K14 -
 14:05
14:05
Sideserf Cake Studio
1 day ago $20.34 earnedHYPERREALISTIC HAND CAKE GLOW-UP (Old vs. New) 💅
78.4K15 -
 28:37
28:37
marcushouse
1 day ago $15.22 earnedSpaceX Just Dropped the Biggest Starship Lander Update in Years! 🤯
49.5K20 -
 14:54
14:54
The Kevin Trudeau Show Limitless
4 days agoThe Hidden Force Running Your Life
133K28 -
 2:16:35
DLDAfterDark
15 hours ago $17.88 earnedIs The "SnapPocalypse" A Real Concern? Are You Prepared For SHTF? What Are Some Considerations?
43.7K15