BITCOIN Stringent Analysis - 150K?
OOOPss, I am not technical trade advisor of any kind, just showing you how i trade!!!! BITCOIN Stringent Analysis - 150K? Summary (Stringent TA View)
Probability: $150K is technically plausible — supported by cycle channels, Fibonacci projections, and chart pattern measured moves.
Catalysts needed: Institutional ETF inflows, stable macro environment, and no major regulatory backlash.
Risks: At these extremes, TA is vulnerable to large reversals—leverage/liquidation events typically happen at cycle peaks.
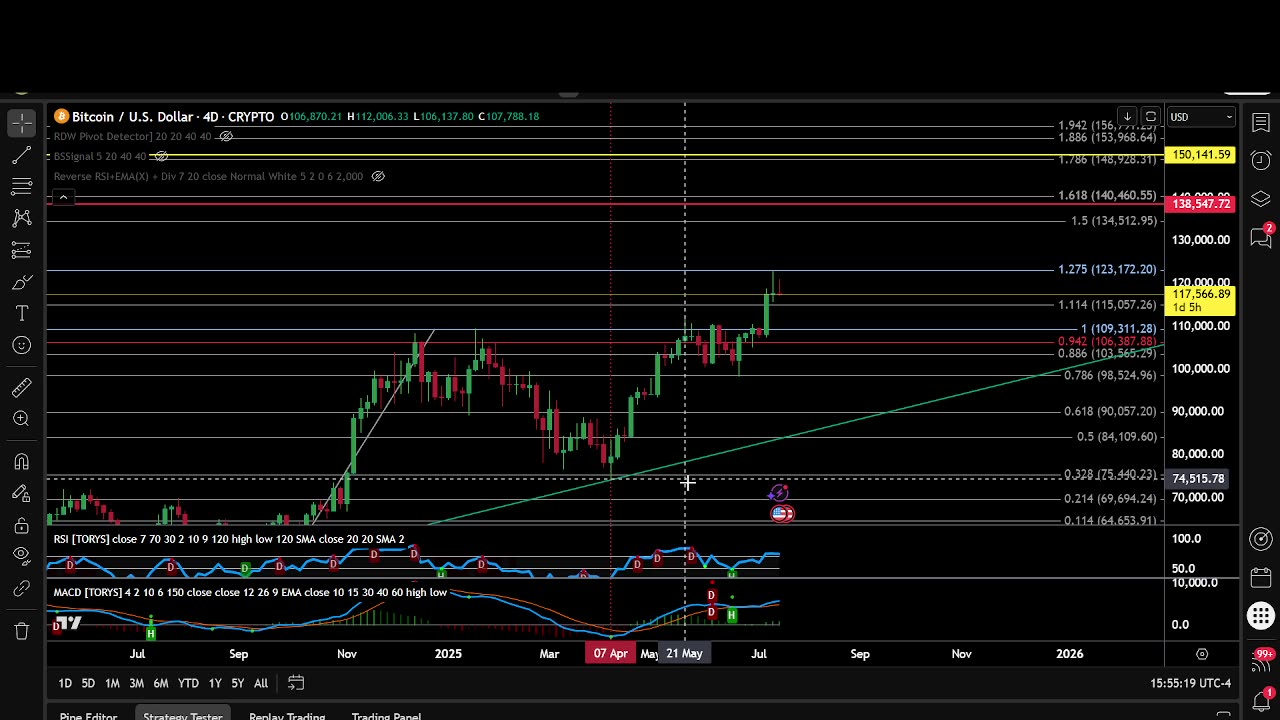
Here’s a simulated Bitcoin chart for 2025, overlaid with:
Support zones at ~$112.5K and $115.5K (green lines)
Resistance zones at ~$120K and $126K (red/orange lines)
Target level at $150K (purple line)
RSI (14) (blue curve, right axis), showing mild bullish momentum
MACD & Signal (bottom-right inset), indicating trend strength
This gives you a technical visual for how the path toward $150K might look if Bitcoin respects major support/resistance and maintains healthy momentum.
Bounce from $115–116K → rally through $122K → test $125–126K → begin acceleration toward 150K.
⚠️ If price breaks below $115K and MACD turns bearish on weekly, a deeper correction near $110K–112K becomes likely.
-
 LIVE
LIVE
Benny Johnson
1 hour agoBiden Appears With MASSIVE Scar on Face, New Health Horror Revealed! Sobbing Jimmy Kimmel FLEEING US
3,862 watching -
 UPCOMING
The Big Mig™
3 hours agoBig Pharma's Puppets: RFK Jr. Takes on Congress
2535 -
 LIVE
LIVE
Total Horse Channel
10 hours ago2025 Reno Snaffle Bit Futurity | Friday
30 watching -
 26:40
26:40
Rethinking the Dollar
46 minutes agoPeter Schiff: "Trump's Economy WORSE Than Biden" | Morning Check-In: Let's Talk...
151 -
 LIVE
LIVE
Badlands Media
6 hours agoBadlands Daily: September 5, 2025
3,886 watching -
 24:00
24:00
Bearing
2 hours agoThe Week LIBERALS Thought TRUMP DIED 💥 (And Went INSANE) 🤣
3.56K11 -
 LIVE
LIVE
GritsGG
51 minutes agoWin Streaking!! 🫡!
38 watching -
 1:41:36
Dear America
2 hours agoWelcome To The Dept Of WAR! RFK DESTROYS The CDC! + Should Trans Own Guns?!
71.1K46 -
 LIVE
LIVE
Matt Kohrs
9 hours agoStocks Hit Record High, Breaking Jobs News || Live Day Trading & Analysis
681 watching -
 LIVE
LIVE
Wendy Bell Radio
6 hours agoSchilling For Big Pharma
7,459 watching