Excel 2019 In Practice - Ch 9 Guided Project 9-3 - Courtyard Medical Plaza
Guided Project 9-3
Courtyard Medical Plaza has new worksheets for weight loss workshops. You use Solver with sample data and add scenarios
and data tables to complete a sample set.
[Student Learning Outcomes 9.1, 9.3, 9.4, 9.6]
File Needed: CourtyardMedical-09.xlsx (Available from the Start File link.)
Completed Project File Name: [your name]-CourtyardMedical-09.xlsx
Skills Covered in This Project
Create and manage scenarios.
Use Solver in a worksheet to find a solution.
Build a one-variable data table.
Build a two-variable data table.
Generate Descriptive Statistics for a set of data.
1. Open the CourtyardMedical-09 start file. The file will be renamed automatically to include your name. Change the
project file name if directed to do so by your instructor
NOTE: If group titles are not visible on your Ribbon in Excel for Mac, click the Excel menu and select Preferences to open
the Excel Preferences dialog box. Click the View button and check the Group Titles check box under In Ribbon, Show.
Close the Excel Preferences dialog box.
2. Enable the content in the security warning.
3. Install Solver and the Analysis ToolPak.
a.
b.
c.
d.
4.
Select the Tools menu.
Select Excel Add-ins…
Select the Solver Add-in box.
Select the Analysis ToolPak box and click OK.
Click the Workout Plan worksheet tab and select cell E10. Five activities are summed to count calories. This cell
includes a SUM formula.
5. Add scenarios in a worksheet.
a. Select cells D5:D9.
b.
c.
d.
e.
f.
g.
h.
Click the What-if Analysis button [Data tab, Forecast group] and select Scenario Manager.
Click + and type Basic Plan as the name.
Verify or set the Changing cells box to display D5:D9 and click OK.
Do not edit the Scenario Values and click OK.
Click + to add another scenario.
Type Double as the name, keep the Changing cells as D5:D9, and click OK.
Change the values to 2, 2, 4, 2, and 2, doubling each current value, in the Scenario Values dialog box and click OK
(Figure 9-76).
1/3
https://gcccd.instructure.com/courses/38544/assignments/793843?module_item_id=1692540
4/10/2021 SIMnet - Excel 2019 In Practice - Ch 9 Guided Project 9-3
https://gcccd.instructure.com/courses/38544/assignments/793843?module_item_id=1692540 2/3
Figure 9-76 Edited scenario values
Figure 9-77 Solver parameters and constraints
Figure 9-78 Generated scenario summary
i. Click Close and select cell B3.
6. Use Solver to find a maximum calorie burn.
a. Click the Solver button [Data tab, Analysis group].
b. Select cell E10, the cell with a SUM formula, for the Set Objective box.
c. Verify or select the Max radio button.
d. Click the By Changing Variable Cells box and select cells D5:D7 to adjust
the occurrences of three activities in the workout plan.
7. Add constraints to a Solver problem.
a. Click Add to the right of the Subject to the Constraints box.
b. Select cell D5 for the Cell Reference box and choose int as the operator. The Constraint box displays integer to
require that the result be a whole number.
c. Click Add to add each of constraints shown here:
D5 <=4
D5 >=2
D6 int
D6 <=3
D6 >=1
D7 int
D7 <=4
D7 >=1
d. When all constraints are identified, click OK in the Add Constraint dialog box.
e. Verify or select Simplex LP for the Select a Solving Method option.
f. Confirm that the Make Unconstrained Variables Non-Negative box is selected (Figure 9-77).
g. Click Solve. A solution displays in the worksheet, and
the Solver Results dialog box is open.
8. Save Solver results as a scenario.
a. Click Save Scenario in the Solver Results dialog box.
b. Type Solver as the scenario name.
c. Click OK to return to the Solver Results dialog box.
d. Select the Restore Original Values button and click
OK.
9. Create a scenario summary report.
a. Click the What-if Analysis button [Data tab, Forecast
group] and select Scenario Manager.
b. Click the Summary button and verify that the Scenario
summary button is selected.
c. Select cells D5:D9 for the Result cells box, type a
comma (,) and then select cell E10.
d. Click OK to create the report (Figure 9-78).
10. Create a one-variable data table to calculate total calories if
dinner calories are adjusted.
a. Click the Calorie Journal worksheet tab and select cell
I5. The SUM formula calculates total calories consumed
per day.
b. Select cell E15. The formula for the data table must be
one column to the right and one row above the first input
value.
c. Type =, click cell I5, and press Enter.
d. Select cells D15:E23 as the data table range.
e. Click the What-If Analysis button [Data tab, Forecast
group] and choose Data Table.
f. Click the Column input cell box and select cell G5. The input values will be substituted for this cell in the data table
formula.
g. Click OK (Figure 9-79).
11. Create a two-variable data table to calculate total calories if both lunch and dinner calories are adjusted.
a. Select cell L15. A two- variable table has one formula, one row above column inputs and one column left of row
values.
4/10/2021
SIMnet - Excel 2019 In Practice - Ch 9 Guided Project 9-3
b.
c.
d.
e.
f.
g.
12.
Type =, click cell I5, and press Enter.
Select cells L15:T23.
Click the What-If Analysis button [Data tab, Forecast group] and choose
Data Table.
Select cell E5 for the Row input cell box. Lunch calories are in the row of
this data table.
Click the Column input cell box and select cell G5. Dinner calories are in
the column.
Click OK to build the data table (Figure 9-80).
Select cell J1 and insert a page break [Page Layout tab,
Page Setup group].
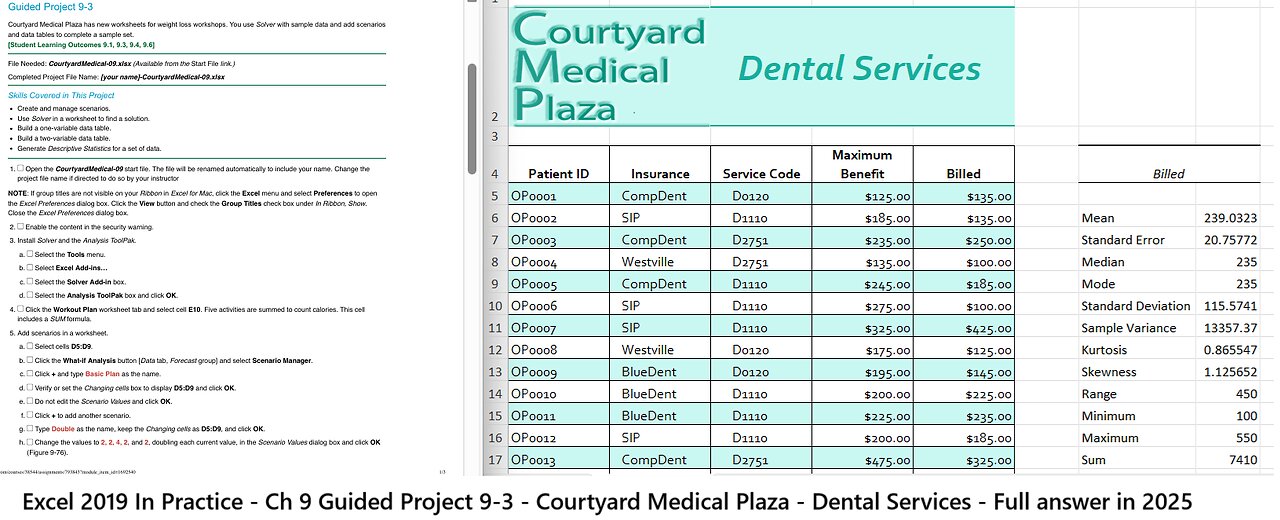
13. Generate Descriptive Statistics for a rating category.
a. Click the Dental Insurance sheet tab.
b.
c.
d.
e.
f.
Click the Data Analysis button [Data tab, Analysis
group].
Select Descriptive Statistics and click OK.
Select cells E4:E35 for the Input Range box.
Select the Labels in First Row box.
Figure 9-79 One-variable data table with
results
Figure 9-80 Two-variable data table with results
Select the Output Range button, click the Output Range box, and select cell G4.
g.
h.
14.
Select the Summary statistics box and click OK.
AutoFit column G (Figure 9-81).
Figure 9-81 Summary statistics for the billed amounts
Save and close the workbook.
15.
16.
Upload and save your project file.
Submit project for grading.
-
 8:11
8:11
MattMorseTV
18 hours ago $18.73 earnedTrump's DECLARATION of WAR.
37K93 -
 3:44
3:44
GritsGG
16 hours agoUpdate Your Warzone Loadouts w/ These Tips!
16.4K1 -
 2:31:01
The Connect: With Johnny Mitchell
19 hours ago $24.14 earned"It's About To Get Worse"- CIA Agent Andrew Bustamante Explains Why It's Time To Leave America
24.3K46 -
 36:28
36:28
TruthStream with Joe and Scott
1 day agoMark Attwood joins TruthStream in Ireland by the lake to discuss all things from Crowley to Ireland to UFOs
16.1K36 -
 2:13:30
Side Scrollers Podcast
1 day agoUK Introduces MANDATORY Digital ID + Dallas ICE Shooting BLAMED on Gaming + More | Side Scrollers
202K74 -
 LIVE
LIVE
Lofi Girl
2 years agoSynthwave Radio 🌌 - beats to chill/game to
124 watching -
 2:26:44
Tundra Tactical
11 hours ago $20.90 earned🎉 Pro-2A Party LIVE! | Zeke Stout Joins The Show With Tacoma Tactical
29.5K1 -
 2:36:47
BlackDiamondGunsandGear
13 hours agoAFTER HOURS ARMORY / The LEFT are Recruiting / Join the Leftist Gun Club?
17.2K8 -
 16:07
16:07
Ken LaCorte: Elephants in Rooms
17 hours ago $5.44 earnedWhy firefighting got political
28.4K8 -
 8:31
8:31
Rethinking the Dollar
21 hours agoBitcoin Secrets Nobody Talks About!
18.5K8