Excel Project 3-3 - SIMnet - Blue Lake Sporting Goods - Full answer in 2025 - Step-by-step
Explode a pie slice.
Delete the legend from a chart.
Reposition data labels in a chart.
Create a clustered bar chart object.
Format data labels and data series.
Add Alt Text to a chart.
Insert and format sparklines in a worksheet.
Steps to complete This Project
Mark the steps as checked when you complete them.
1. Open the BlueLake-03 start file. If the workbook opens in Protected View, click the
Enable Editing button so you can modify it. The file will be renamed automatically to
include your name. Change the project file name if directed to do so by your instructor, and
save it.
2. Create a pie chart object.
a.
b.
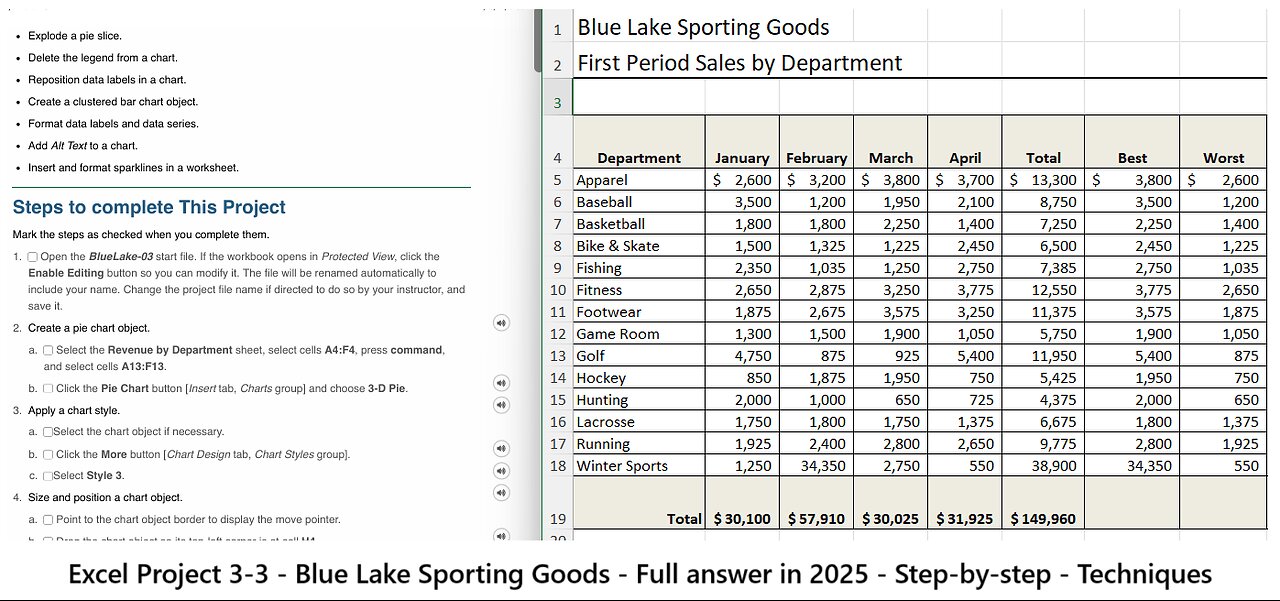
Select the Revenue by Department sheet, select cells A4:F4, press command,
and select cells A13:F13.
Click the Pie Chart button [Insert tab, Charts group] and choose 3-D Pie.
3. Apply a chart style.
a.
b.
c.
Select the chart object if necessary.
Click the More button [Chart Design tab, Chart Styles group].
Select Style 3.
4. Size and position a chart object.
a.
b.
c.
d.
Point to the chart object border to display the move pointer.
Drag the chart object so its top-left corner is at cell H4.
Point to the bottom right selection handle to display the resize arrow.
Drag the pointer to reach cell Q19.
5. Explode a pie slice.
a.
b.
Double-click the pie to open its Format Data Series task pane.
Click the San Diego slice to update the pane to the Format Data Point task pane.
(Rest the pointer on a slice to see its identifying ScreenTip or refer to the legend.)
https://mdchialeah.simnetonline.com/sp/assignments/projects/details/8567505
Page 2 of 8
Excel Project 3-3 - SIMnet
2/10/24, 9:08 PM
c.
d.
e.
Click the Series Options button in the Format Data Point task pane.
Set the pie explosion percentage at 10%.
Close the task pane and click the chart object border to deselect the San Diego
-
 13:54
13:54
Degenerate Jay
12 hours ago5 Best Superhero Movies To Watch On Halloween
11.1K2 -
 59:03
59:03
NAG Podcast
5 hours agoSarah Fields: BOLDTALK W/Angela Belcamino
17.7K5 -
 1:21:41
Glenn Greenwald
8 hours agoGlenn Takes Your Questions: On the Argentina Bailout, Money in Politics, and More | SYSTEM UPDATE #541
76.8K38 -
 3:10:08
Barry Cunningham
5 hours agoPRESIDENT TRUMP TO USE NUCLEAR OPTION? FOOD STAMPS END! | SHUTDOWN DAY 31
45.2K30 -
 1:06:56
BonginoReport
13 hours agoThe Battle Between Good & Evil w/ Demonologist Rick Hansen - Hayley Caronia (Ep.168)
97.9K32 -
 1:12:57
Kim Iversen
8 hours agoBill Gates Suddenly Says “Don’t Worry About Climate Change”?
88.3K60 -
 1:05:12
Michael Franzese
8 hours agoI Waited 50 Years to Tell You What Happened on Halloween 1975
44K16 -
 1:07:15
Candace Show Podcast
8 hours agoINFILTRATION: Charlie Kirk Was Being Tracked For Years. | Candace Ep 256
90.7K343 -
 LIVE
LIVE
Rallied
7 hours ago $2.56 earnedWarzone Solo Challenges then RedSec Domination
216 watching -
 2:34:30
Red Pill News
9 hours agoBoomerang Time - DOJ Investigating BLM Fraud on Red Pill News Live
72.8K14