USING MICROSOFT EXCEL 2016 - Independent Project 3-4 - Classic Garden - Full answer in 2025
USING MICROSOFT EXCEL 2016
Independent Project 3-4
Independent Project 3-4
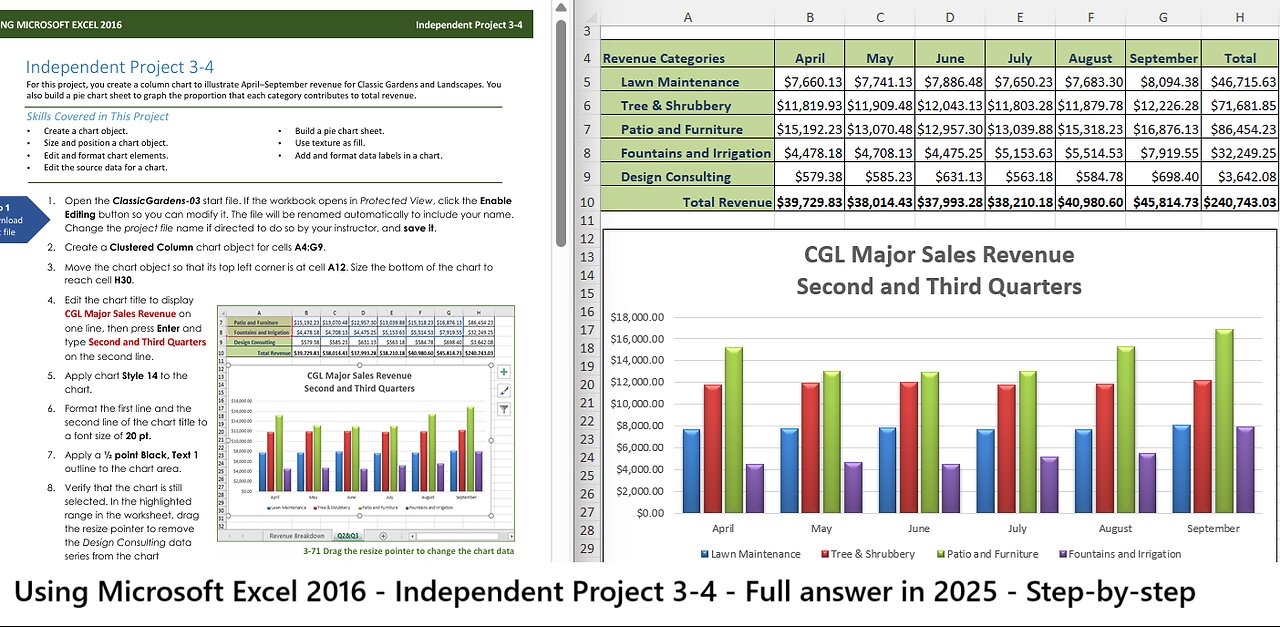
For this project, you create a column chart to illustrate April–September revenue for Classic Gardens and Landscapes. You
also build a pie chart sheet to graph the proportion that each category contributes to total revenue.
Skills Covered in This Project
Create a chart object.
Size and position a chart object.
Edit and format chart elements.
Edit the source data for a chart.
Build a pie chart sheet.
Use texture as fill.
Add and format data labels in a chart.
Download
start file
1. Open the ClassicGardens-03 start file. If the workbook opens in Protected View, click the Enable
Editing button so you can modify it. The file will be renamed automatically to include your name.
Change the project file name if directed to do so by your instructor, and save it.
2. Create a Clustered Column chart object for cells A4:G9.
3. Move the chart object so that its top left corner is at cell A12. Size the bottom of the chart to
reach cell H30.
4. Edit the chart title to display
CGL Major Sales Revenue on
one line, then press Enter and
type Second and Third Quarters
on the second line.
5. Apply chart Style 14 to the
chart.
6. Format the first line and the
second line of the chart title to
a font size of 20 pt.
7. Apply a ½ point Black, Text 1
outline to the chart area.
8. Verify that the chart is still
selected. In the highlighted
range in the worksheet, drag
the resize pointer to remove
the Design Consulting data
series from the chart
(Figure 3-71).
3-71 Drag the resize pointer to change the chart data
9. Create a 3-D Pie chart for cells A4:A9 and cells H4:H9. Move the chart to its own sheet named
Revenue Breakdown. Hint: Use the Move Chart button [Chart Tools Design tab, Location group].
10. Edit the chart title to display Revenue by Category. Change the font size to 32.
11. Select the legend and change the font size to 12.
12. Apply the Woven mat texture fill to the Patio and Furniture slice.
Excel 2016 Chapter 3 Creating and Editing Charts
Last Updated: 11/16/16 Page 1
Excel 2016 Chapter 3 Creating and Editing Charts Last Updated: 11/16/16 Page 2
USING MICROSOFT EXCEL 2016 Independent Project 3-4
13. Add data labels to display in the center of each slice.
a. Display the Format Data Labels task pane, choose the Accounting format, and set 0 decimal
places.
b. While the data labels are selected, change the font size to 14 pt and apply bold [Home tab,
Font group].
14. Deselect the chart.
15. Save and close the
workbook (Figure 3-72).
16. Upload and save your
project file.
17. Submit project for grading.
Upload &
Save
Grade my
Project
3-72 Excel 3-4 completed chart sheets
-
 22:01
22:01
Jasmin Laine
4 hours agoCBC Host ABRUPTLY ENDS Interview After Guest Says: “That Isn't True”
4983 -
 1:20:47
Kim Iversen
2 hours agoMAGA = Make Antisemitism Great Again?
96.9K83 -
 1:06:09
Tucker Carlson
6 hours agoUS Government Admits Chemtrails Are Real (It's Worse Than You Think). Dane Wigington Reveals All.
18.4K118 -
 1:51:06
Redacted News
3 hours agoTrump Rolling Out $2,000 STIMULUS Checks in 2025 as the U.S. Economy Flashes RED | Redacted News
141K167 -
 LIVE
LIVE
Dr Disrespect
8 hours ago🔴LIVE - DR DISRESPECT - ARC RAIDERS - THE VENATOR SLAYER
1,370 watching -
 13:26
13:26
Cash Jordan
2 hours agoChicago "RIOTERS" Get CRUSHED... Mayor FREAKS as 'Imported Mob' HAMMERED BY MARINES
3.93K -
 2:01:03
vivafrei
5 hours agoOstrich Farm Update w/ Chris Dacey; Jan. 6 Pipe Bomber IDENTIFIED? w/Kyle Serraphin & MORE!
79.5K59 -
 1:01:11
The Amber May Show
5 hours ago $0.24 earnedShutdowns, Shakeups, and 50-Year Mortgages | Sam Anthony
3.68K2 -

StoneMountain64
6 hours agoBattlefield REDSEC $100k tourney tomorrow
11.1K1 -
 LIVE
LIVE
GritsGG
4 hours ago#1 Most Warzone Wins 3957+!
47 watching