USING MICROSOFT EXCEL 2016 - Independent Project 3-4 - Classic Garden - Full answer in 2025
USING MICROSOFT EXCEL 2016
Independent Project 3-4
Independent Project 3-4
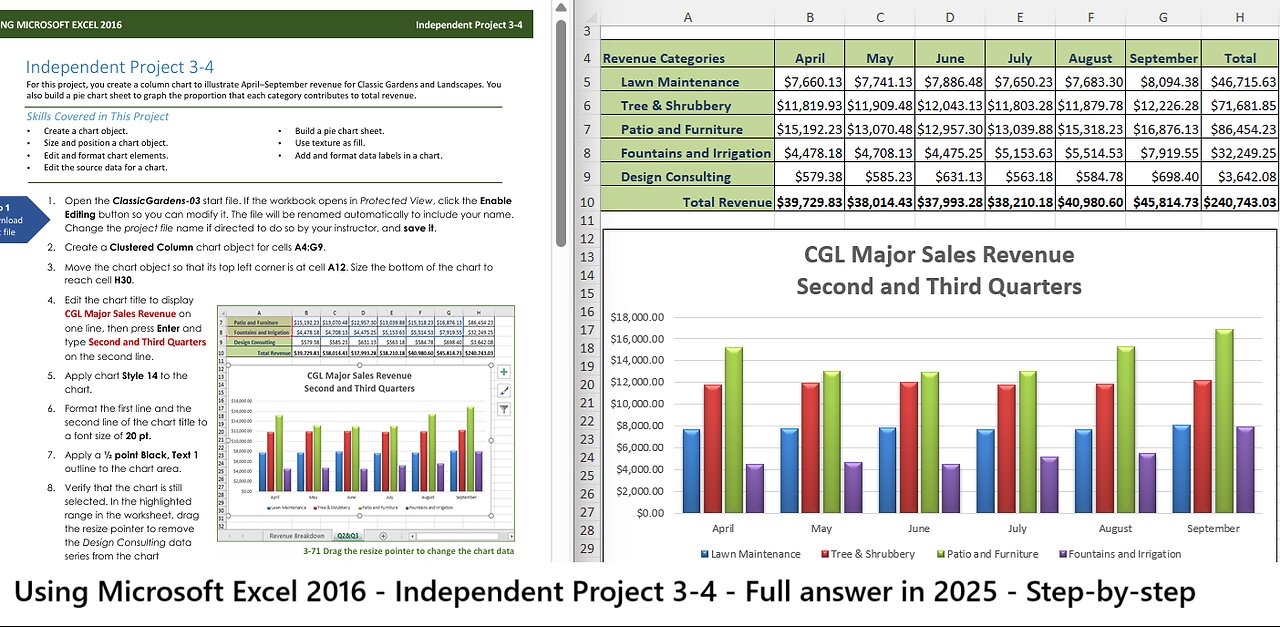
For this project, you create a column chart to illustrate April–September revenue for Classic Gardens and Landscapes. You
also build a pie chart sheet to graph the proportion that each category contributes to total revenue.
Skills Covered in This Project
Create a chart object.
Size and position a chart object.
Edit and format chart elements.
Edit the source data for a chart.
Build a pie chart sheet.
Use texture as fill.
Add and format data labels in a chart.
Download
start file
1. Open the ClassicGardens-03 start file. If the workbook opens in Protected View, click the Enable
Editing button so you can modify it. The file will be renamed automatically to include your name.
Change the project file name if directed to do so by your instructor, and save it.
2. Create a Clustered Column chart object for cells A4:G9.
3. Move the chart object so that its top left corner is at cell A12. Size the bottom of the chart to
reach cell H30.
4. Edit the chart title to display
CGL Major Sales Revenue on
one line, then press Enter and
type Second and Third Quarters
on the second line.
5. Apply chart Style 14 to the
chart.
6. Format the first line and the
second line of the chart title to
a font size of 20 pt.
7. Apply a ½ point Black, Text 1
outline to the chart area.
8. Verify that the chart is still
selected. In the highlighted
range in the worksheet, drag
the resize pointer to remove
the Design Consulting data
series from the chart
(Figure 3-71).
3-71 Drag the resize pointer to change the chart data
9. Create a 3-D Pie chart for cells A4:A9 and cells H4:H9. Move the chart to its own sheet named
Revenue Breakdown. Hint: Use the Move Chart button [Chart Tools Design tab, Location group].
10. Edit the chart title to display Revenue by Category. Change the font size to 32.
11. Select the legend and change the font size to 12.
12. Apply the Woven mat texture fill to the Patio and Furniture slice.
Excel 2016 Chapter 3 Creating and Editing Charts
Last Updated: 11/16/16 Page 1
Excel 2016 Chapter 3 Creating and Editing Charts Last Updated: 11/16/16 Page 2
USING MICROSOFT EXCEL 2016 Independent Project 3-4
13. Add data labels to display in the center of each slice.
a. Display the Format Data Labels task pane, choose the Accounting format, and set 0 decimal
places.
b. While the data labels are selected, change the font size to 14 pt and apply bold [Home tab,
Font group].
14. Deselect the chart.
15. Save and close the
workbook (Figure 3-72).
16. Upload and save your
project file.
17. Submit project for grading.
Upload &
Save
Grade my
Project
3-72 Excel 3-4 completed chart sheets
-
 LIVE
LIVE
The Jimmy Dore Show
1 hour agoTrump’s HUGE About-Face on the COVID Vaxx! Epstein Victims Demand Justice In DC! w/ Mary Holland
5,517 watching -
 LIVE
LIVE
The Mel K Show
1 hour agoLive Q&A With Mel K 9-3-25
408 watching -
 LIVE
LIVE
Quite Frankly
5 hours agoOccult Pop Culture & The Anne Heche Mystery | Christopher Knowles 9/3/25
413 watching -
 LIVE
LIVE
The Mike Schwartz Show
2 hours agoTHE MIKE SCHWARTZ SHOW Evening Edition 09-03-2025
4,394 watching -
 1:06:42
TheCrucible
2 hours agoThe Extravaganza! EP: 31 (9/03/25
67K1 -
 LIVE
LIVE
Wayne Allyn Root | WAR Zone
6 hours agoWAR Zone LIVE | 3 SEPTEMBER 2025
110 watching -
 1:28:57
Redacted News
3 hours agoBREAKING! Putin's DEVASTATING news for Europe | Secret UFO Space Base in Huntsville | Redacted Live
85.8K99 -
 1:17:49
vivafrei
5 hours agoEpstein Press Conference DEBACLE! Missing Minute FOUND? Canada Continues to Fall! & MORE!
85.6K67 -
 29:30
29:30
Stephen Gardner
3 hours ago🟢YES! Trump’s Doing It! Ben Shapiro UNLEASHES on Democrat STUPIDITY!
34.4K17 -
 LIVE
LIVE
Dr Disrespect
7 hours ago🔴LIVE - DR DISRESPECT - METAL EDEN - NEW 2025 SCI-FI FPS LAUNCH STREAM
944 watching