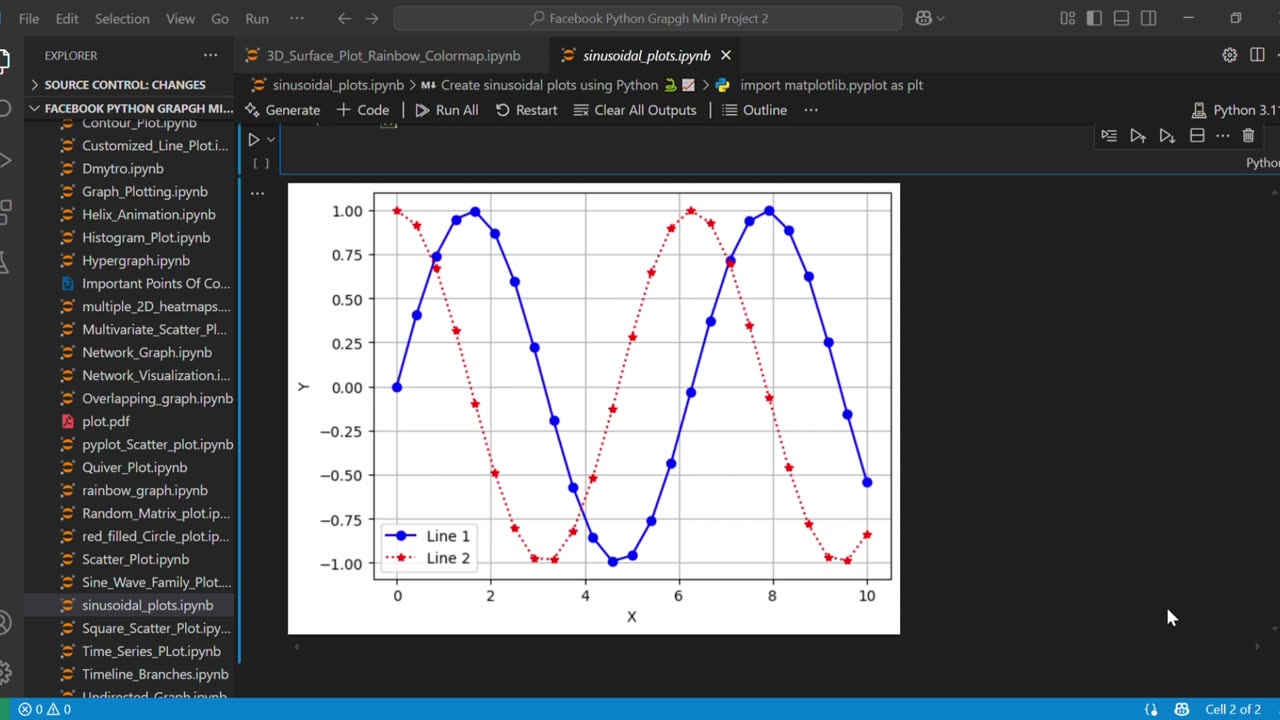
Create sinusoidal plots using Python 🐍📈
📈 Sinusoidal Plotting in Python Made Easy | Matplotlib Tutorial
Learn how to plot sine and cosine waves using Python and Matplotlib in this beginner-friendly tutorial!
We’ll walk through generating data with NumPy and visualizing it with clean, easy-to-understand line plots.
Perfect for students, developers, and anyone interested in data
visualization, math functions, or Python graphing.
Github Link:https://github.com/nazishjaveed/Pytho...
📌 In this video:
Generating X values using NumPy
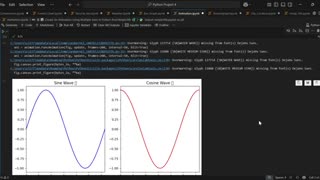
Plotting sin(x) and cos(x)
Customizing line styles and markers
Adding labels, grid, and legend
Making your graphs look professional
👉 Whether you're new to Python or brushing up your plotting skills, this tutorial will help you get comfortable with sinusoidal plots in no time.
Don’t forget to like 👍, comment 💬, and subscribe 🔔 for more Python tutorials!
#python #matplotlib #datavisualization #sinwave #coswave #pythontutorial #pythonplotting #pythonforbeginners #matplotlibtutorial #numpy #coding #sinusoidalplot #pythonvisualization #learnpython #pythonprojects #techtutorial #mathvisualization #trigfunctions #pythoncoding #pythonchart
-
 0:52
0:52
AI Evolutionary Technology
5 days agoCreate Synchronized Multi-Plot Animations in Python
91 -
 LIVE
LIVE
LFA TV
14 hours agoLFA TV ALL DAY STREAM - TUESDAY 9/2/25
938 watching -
 LIVE
LIVE
LIVE WITH CHRIS'WORLD
5 hours agoLIVE WITH CHRIS'WORLD - IT WORKED IN D.C. & IT WILL WORK IN CHICAGO
105 watching -
 40:44
40:44
Ohio State Football and Recruiting at Buckeye Huddle
5 hours agoOhio State Football: 10 Things We Learned From Rewatching the Texas Win
3.77K -
 LIVE
LIVE
Edge of Wonder
7 hours agoRemote Viewing 3I/ATLAS & Yellowstone’s Weird Anomalies
265 watching -
 1:08:47
TheCrucible
4 hours agoThe Extravaganza! EP: 30
78.2K8 -
 1:16:58
Kim Iversen
9 hours agoCOVID VACCINE HORROR: Fertility Destroyed & DNA Altered? | Nicolas Hulscher, MPH
44.1K96 -
 1:58:54
Wayne Allyn Root | WAR Zone
7 hours agoWAR Zone LIVE | 2 SEPTEMBER 2025
14.5K1 -
 1:01:05
Jeff Ahern
4 days ago $2.32 earnedFriday Freak out with Jeff Ahern
29K8 -
 1:51:40
Redacted News
4 hours agoHIGH ALERT! TRUMP IS COMING FOR CHICAGO, U.S. TROOPS PREPARING INVASION TO STOP MURDERS | REDACTED
126K218