New Perspectives Excel 2019 | Module 11: SAM Project 1b | Romano Collectibles (Update 2025)
New Perspectives Excel 2019 | Module 11: SAM Project 1b
Romano Collectibles
CREATE ADVANCED PIVOTTABLES AND USE DATABASE FUNCTIONS
GETTING STARTED
• Open the file NP_EX19_11b_FirstLastName_1.xlsx, available for download from the SAM website.
• Save the file as NP_EX19_11b_FirstLastName_2.xlsx by changing the “1” to a “2”.
o If you do not see the .xlsx file extension in the Save As dialog box, do not type it. The program will add the file extension for you automatically.
• With the file NP_EX19_11b_FirstLastName_2.xlsx still open, ensure that your first and last name is displayed in cell B6 of the Documentation sheet.
o If cell B6 does not display your name, delete the file and download a new copy from the SAM website.
PROJECT STEPS
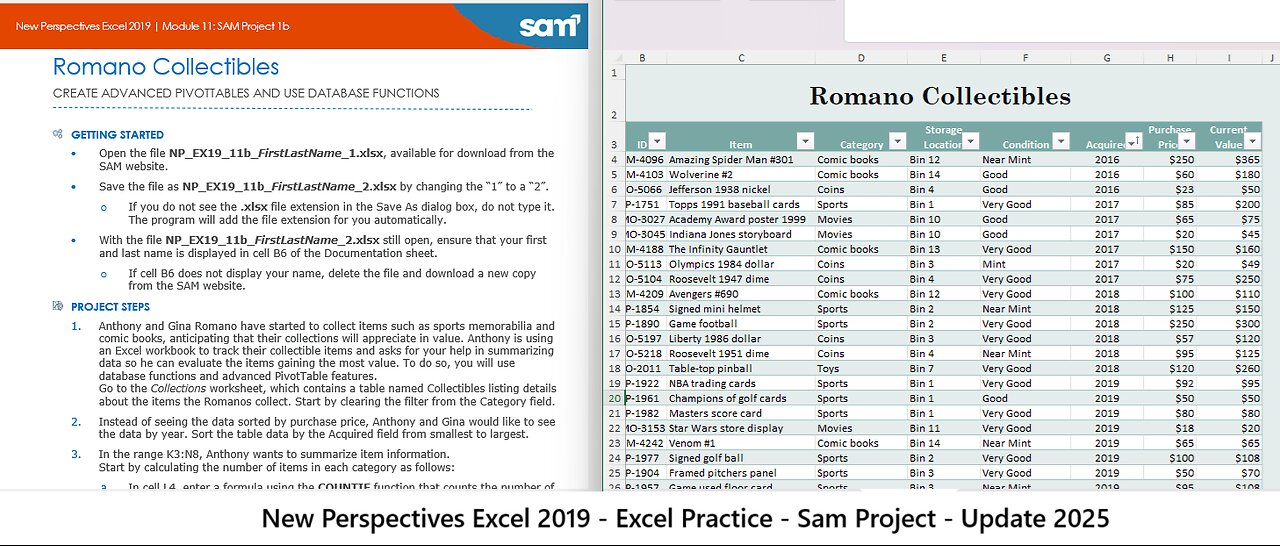
1. Anthony and Gina Romano have started to collect items such as sports memorabilia and comic books, anticipating that their collections will appreciate in value. Anthony is using an Excel workbook to track their collectible items and asks for your help in summarizing data so he can evaluate the items gaining the most value. To do so, you will use database functions and advanced PivotTable features.
Go to the Collections worksheet, which contains a table named Collectibles listing details about the items the Romanos collect. Start by clearing the filter from the Category field.
2. Instead of seeing the data sorted by purchase price, Anthony and Gina would like to see the data by year. Sort the table data by the Acquired field from smallest to largest.
3. In the range K3:N8, Anthony wants to summarize item information.
Start by calculating the number of items in each category as follows:
a. In cell L4, enter a formula using the COUNTIF function that counts the number of comic books, checking that the Category column in the Collectibles table (Collectibles[Category]) is equal to the value in cell K4.
b. Fill the range L5:L8 with the formula in cell L4.
4. In column M, Anthony wants to calculate the total value of the items in each category. Determine the total values as follows:
a. In cell M4, enter a formula using the SUMIF function that totals the value for comic books, checking that the Category column in the Collectibles table (Collectibles[Category]) is equal to the value in cell K4, and that the formula totals all the current values (Collectibles[Current Value]).
b. Fill the range M5:M8 with the formula in cell M4.
5. In column N, Anthony wants to calculate the average value of the items in each category. Determine the average values as follows:
a. In cell N4, enter a formula using the AVERAGEIF function that averages the value for comic books, checking that the Category column in the Collectibles table (Collectibles[Category]) is equal to the value in cell K4, and that the formula averages all the current values (Collectibles[Current Value]).
b. Fill the range N5:N8 with the formula in cell N4.
6. Go to the Value by Condition worksheet. Anthony has created a PivotTable on this worksheet to list the final current value of the collectible items by category, condition, and year. He grouped the year data into two-year spans, but wants them listed as separate years.
Ungroup the year data in the PivotTable.
7. Anthony thinks the PivotTable looks crowded in its default Compact layout.
Change the report layout to show the PivotTable in Tabular Form.
8. Go to the Items by Category worksheet. Anthony created a PivotTable that lists each item by category, and then counts the number of those items acquired each year. The data is sorted in alphabetic order by category, but Anthony wants to sort the data by total number of items. He also wants to focus on coins and comic books only.
Change the display of the PivotTable as follows:
a. Sort the data in descending order by Grand Total.
b. Apply a Label Filter that displays Category values that begin with Co.
9. Go to the Price and Value Comparison worksheet. The PivotTable on this worksheet lists the purchase prices and current values for each category of collectible item. Anthony wants to include the number of items in each category in the second column of the PivotTable.
Make this change for Anthony as follows:
a. Add the ID field to the Values area of the PivotTable, making it the first field in the Values area.
b. Change the number format of the Count of ID amounts to Number with 0 decimal places.
10. Anthony wants to know the difference and the percentage of difference between the purchase prices and the current values.
Provide this information for Anthony as follows:
a. Insert a calculated field named Difference that subtracts the Purchase Price field amount from the Current Value field amount.
b. Insert another calculated field named % Difference that subtracts the Purchase Price field amounts from the Current Value field amounts, and then divides the result by the Purchase Price field amount.
c. Change the number format of the Sum of % Difference amounts to Percentage with 2 decimal points.
11. Anthony also wants to include the average purchase price for the items in each category as the last column in the PivotTable.
Add this information to the PivotTable as follows:
a. Add the Purchase Price field to the Values area of the PivotTable, making it the last field in the Values area.
b. Use the Average calculation to summarize the Purchase Price field data.
12. Go to the Purchases by Year worksheet. The PivotTable on this worksheet lists the purchase prices of the collectibles by year and category. Anthony wants to show the names of each collectible item and display the information about the two categories with the highest total purchase prices.
Provide this information for Anthony as follows:
a. Expand the Category field to show the name of each item.
b. Apply a Value Filter to the Category field that displays the top 2 items by the sum of purchase price.
Your workbook should look like the Final Figures on the following pages. Save your changes, close the workbook, and then exit Excel. Follow the directions on the SAM website to submit your completed project.
Final Figure 1: Collections Worksheet
Final Figure 2: Value by Condition Worksheet
Final Figure 3: Items by Category Worksheet
Final Figure 4: Price and Value Comparison Worksheet
Final Figure 5: Purchases by Year Worksheet
-
 43:25
43:25
Katie Miller Pod
51 minutes agoEpisode 5 - Mike Tyson | The Katie Miller Podcast
143 -
 1:04:12
TheCrucible
2 hours agoThe Extravaganza! EP: 33 (9/08/25)
45K7 -

Kim Iversen
3 hours agoDepartment Of War is BACK: JD Vance Says "I Don't Give A Sh*t"
17.5K28 -
 LIVE
LIVE
The Amber May Show
3 hours agoSocialism Rising, Immigration Operation, and Tariff Battles | Sam Anthony
114 watching -

Dr Disrespect
7 hours agoLIVE - DR DISRESPECT - MARVEL RIVALS, PUBG, OFF THE GRID - TRIPLE THREAT GAME CHALLENGE
78.9K14 -
 1:11:09
Candace Show Podcast
2 hours agoBecoming Brigitte: MK Ultra And The French Gold Rush.
36.3K33 -
 1:44:19
Redacted News
3 hours agoHIGH ALERT! BRICS CALLS EMERGENCY MEETING IN BRAZIL, TRUMP THREATENS TO DESTROY RUSSIAN ECONOMY
113K65 -
 44:17
44:17
Stephen Gardner
2 hours ago🔥FINALLY! Trumps ORDER TODAY has Democrats PANICKED!
23.2K10 -
 30:38
30:38
Kimberly Guilfoyle
4 hours agoBreaking News Coverage, Live with Former DEA Administrator Derek Maltz & Tony Kinnett | Ep252
22.4K5 -
 48:17
48:17
Mark Kaye
7 hours ago🔴 What Trump Said About Prayer in Schools SHOCKED Everyone!!
44.5K19