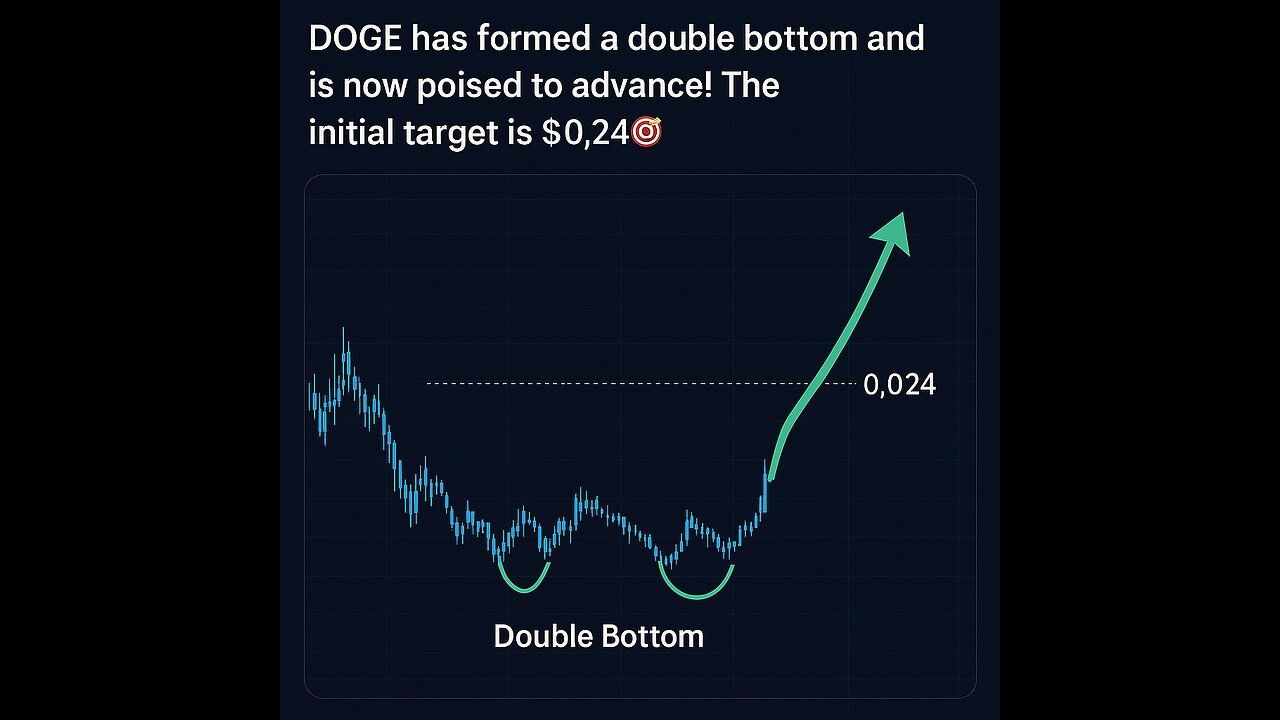
Dogecoin (DOGE) has completed a classic technical setup—a double-bottom reversal #dogecoin
🧭 Key Highlights:
1. Double‑Bottom Formation – The daily chart shows a well-defined double-bottom pattern at approximately $0.15, followed by a decisive breakout above the neckline—a widely recognized bullish signal .
2. Trendline Breakout – DOGE has broken above its 50‑day descending trendline, retested it successfully, and is now forming higher highs and higher lows—clear signs of a trend reversal .
3. Upside Projection – Measuring from the double bottom’s depth to the neckline projects an upside target near $0.24–$0.25. Short-term resistance lies around $0.20–$0.21, with a clear close above consolidating momentum .
4. Supporting Metrics – On-chain data reveals a concentration of holder positions near $0.177, and rising volume and RSI levels further support the bullish thesis .
-
 2:18:38
Side Scrollers Podcast
17 hours agoGTA 6 GETS WRECKED AFTER ANOTHER DELAY + India THREATENS YouTuber Over Video + More | Side Scrollers
66.2K12 -
 18:03
18:03
Nikko Ortiz
1 day agoEBT Meltdowns Are Insane...
5.97K17 -
 9:03
9:03
MattMorseTV
14 hours ago $6.08 earnedTrump’s America First CALL TO ACTION.
14.5K35 -
 17:33
17:33
a12cat34dog
20 hours agoRUMBLE TAKEOVER @ DREAMHACK | VLOG | {HALLOWEEN 2025}
40K25 -
 10:48
10:48
GritsGG
13 hours agoWarzone Stadium Easter Egg! Unlock Grau Blueprint EASY!
6.51K1 -
 LIVE
LIVE
Lofi Girl
3 years agolofi hip hop radio 📚 - beats to relax/study to
208 watching -
 1:43:54
TruthStream with Joe and Scott
3 days agoStuey and Elisa V interview Joe and Scott Q, AI, Glutathione, Tylenol etc 11/5 #510
10K4 -
 29:15
29:15
BlabberingCollector
2 days agoHarry Potter X Fortnite, Fans Reee Over Trans Rights, NEW Audiobooks Are OUT, Wizarding Quick Hits
28.8K3 -
 1:20:42
The Connect: With Johnny Mitchell
6 days ago $9.74 earnedThe Truth Behind The U.S. Invasion Of Venezuela: Ed Calderon Exposes American Regime Change Secrets
31.5K16 -
 2:10:18
FreshandFit
5 hours agoAfter Hours w/ Girls
128K27