New Perspectives Excel 365/2021 | Module 11: SAM Project 1a: Hempstead University Foundation
New Perspectives Excel 365/2021 | Module 11: SAM Project 1a
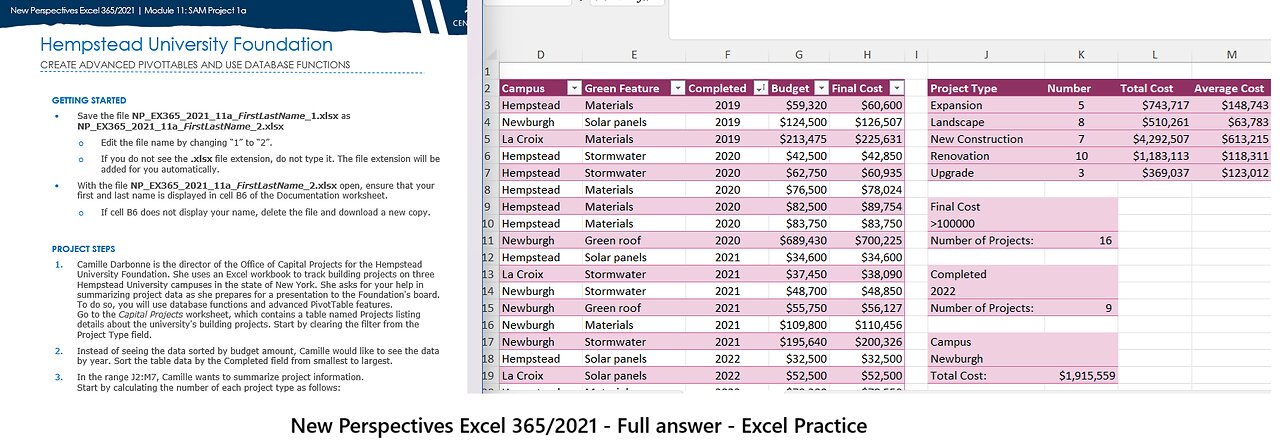
Hempstead University Foundation
CREATE ADVANCED PIVOTTABLES AND USE DATABASE FUNCTIONS
GETTING STARTED
• Save the file NP_EX365_2021_11a_FirstLastName_1.xlsx as NP_EX365_2021_11a_FirstLastName_2.xlsx
o Edit the file name by changing “1” to “2”.
o If you do not see the .xlsx file extension, do not type it. The file extension will be added for you automatically.
• With the file NP_EX365_2021_11a_FirstLastName_2.xlsx open, ensure that your first and last name is displayed in cell B6 of the Documentation worksheet.
o If cell B6 does not display your name, delete the file and download a new copy.
PROJECT STEPS
1. Camille Darbonne is the director of the Office of Capital Projects for the Hempstead University Foundation. She uses an Excel workbook to track building projects on three Hempstead University campuses in the state of New York. She asks for your help in summarizing project data as she prepares for a presentation to the Foundation's board. To do so, you will use database functions and advanced PivotTable features.
Go to the Capital Projects worksheet, which contains a table named Projects listing details about the university's building projects. Start by clearing the filter from the Project Type field.
2. Instead of seeing the data sorted by budget amount, Camille would like to see the data by year. Sort the table data by the Completed field from smallest to largest.
3. In the range J2:M7, Camille wants to summarize project information.
Start by calculating the number of each project type as follows:
a. In cell K3, enter a formula using the COUNTIF function that counts the number of Expansion projects, checking that the column of project types in the Projects table (Projects[Project Type]) is equal to the value in cell J3.
b. Fill the range K4:K7 with the formula in cell K3.
4. In column L, Camille wants to calculate the total cost of each project type. Determine the total costs as follows:
a. In cell L3, enter a formula using the SUMIF function that totals the cost for Expansion projects, checking that the column of project types in the Projects table (Projects[Project Type]) is equal to the value in cell J3, and that the formula totals all the final costs (Projects[Final Cost]).
b. Fill the range L4:L7 with the formula in cell L3.
5. In column M, Camille wants to calculate the average cost of each project type. Determine the average costs as follows:
a. In cell M3, enter a formula using the AVERAGEIF function that averages the cost for Expansion projects, checking that the column of project types in the Projects table (Projects[Project Type]) is equal to the value in cell J3, and that the formula averages all the final costs (Projects[Final Cost]).
b. Fill the range M4:M7 with the formula in cell M3.
6. Go to the Cost by Green Feature worksheet. Camille has created a PivotTable on this worksheet to list the final costs of the projects by green feature, years, and campus. She grouped the year data into two-year spans, but wants them listed as separate years.
Ungroup the year data in the PivotTable.
7. Camille thinks the PivotTable looks crowded in its default Compact layout.
Change the report layout to show the PivotTable in Outline Form.
8. Go to the Cost by Campus worksheet. Camille created a PivotTable that lists each project by ID and campus, and then displays its final cost. The data is sorted in alphabetic order by project ID, but Camille wants to sort the data from smallest to largest total amount. She also wants to focus on renovation projects only, which have an ID that begins with "RE".
Change the display of the PivotTable as follows:
a. Sort the data in ascending order by Grand Total.
b. Apply a Label Filter that displays Project ID values that begin with RE.
9. Go to the Project Budgets worksheet. The PivotTable on this worksheet lists the final cost totals and the budgeted amounts by project type. Camille wants to include the number of projects for each project type in the second column of the PivotTable.
Make this change for Camille as follows:
a. Add the ID field to the Values area of the PivotTable, making it the first field in the Values area.
b. Change the number format of the Count of ID amounts to Number with 0 decimal places.
10. Camille wants to know the difference and the percentage of difference between the final costs and the budgeted amounts.
Provide this information for Camille as follows:
a. Insert a calculated field named Difference that subtracts the Budget field amount from the Final Cost field amount.
b. Insert another calculated field named % Difference that subtracts the Budget field amounts from the Final Cost field amounts, and then divides the result by the Budget field amount.
c. Change the number format of the Sum of % Difference amounts to Percentage with 2 decimal points.
11. Camille also wants to include the average budget for each project type as the last column in the PivotTable.
Add this information to the PivotTable as follows:
a. Add the Budget field to the Values area of the PivotTable, making it the last field in the Values area.
b. Use the Average calculation to summarize the Budget field data.
12. Go to the Project Types by Year worksheet. The PivotTable on this worksheet lists the final costs of the building projects by year and type. Camille wants to show the names of each project and display the information about the two project types with the highest total final cost.
Provide this information for Camille as follows:
a. Expand the Project Type field to show the names of each project.
b. Apply a Value Filter to the Project Type field that displays the top 2 items by the sum of final cost.
Your workbook should look like the Final Figures on the following pages. Save your changes, close the workbook, and then exit Excel. Follow the directions on the website to submit your completed project.
Final Figure 1: Capital Projects Worksheet
Microsoft product screenshot reprinted with permission from Microsoft Incorporated. Copyright © 2018 Cengage Learning. All Rights Reserved.
Final Figure 2: Cost by Green Feature Worksheet
Final Figure 3: Cost by Campus Worksheet
Final Figure 4: Project Budgets Worksheet
Final Figure 5: Project Types by Year Worksheet
#MicrosoftExcel
#Excel
#Practice
#Techniques
-
 LIVE
LIVE
The Bubba Army
21 hours agoNick Hogan Sues Bubba to BLOCK the DOC - Bubba the Love Sponge® Show | 9/03/25
4,288 watching -
 8:01
8:01
MattMorseTV
12 hours ago $10.19 earnedHe's ACTUALLY doing it...
70.5K62 -
 33:25
33:25
Uncommon Sense In Current Times
15 hours ago $1.80 earnedHollywood’s Woke Agenda Exposed | Kevin Sorbo on Cancel Culture, Faith & the Common Sense Revolution
18K -
 8:23
8:23
The Art of Improvement
20 hours ago $0.46 earned7 Smart Habits to Boost Mental Clarity
2.37K2 -
 12:09
12:09
China Uncensored
11 hours agoI Have NEVER Been More Furious
3.98K18 -
 2:12
2:12
WildCreatures
4 days ago $0.83 earnedThe beauty and mystery of the Pantanal, Brazil's best secret
4.17K2 -
 9:38
9:38
Millionaire Mentor
18 hours agoBernie Sanders LOSES IT After Scott Bessent’s Shocking Comeback
8.42K9 -
 1:35:35
Dialogue works
1 day ago $0.54 earnedLarry C. Johnson & Paul Craig Roberts: Trump’s Plan COLLAPSES as Russia Strikes — Xi & Modi Rise!
2.87K3 -
 14:09
14:09
Zoufry
2 days agoThe Hunt for The Biggest Art Thief in US History
6.98K3 -
 29:23
29:23
DeVory Darkins
1 day ago $14.76 earnedTrump makes BOMBSHELL Announcement as Democrat Judge issues SHOCKING Order
26.4K174