How to Graph Shifted Parabolas with Matplotlib
How to Graph Shifted Parabolas with Matplotlib | Python Tutorial
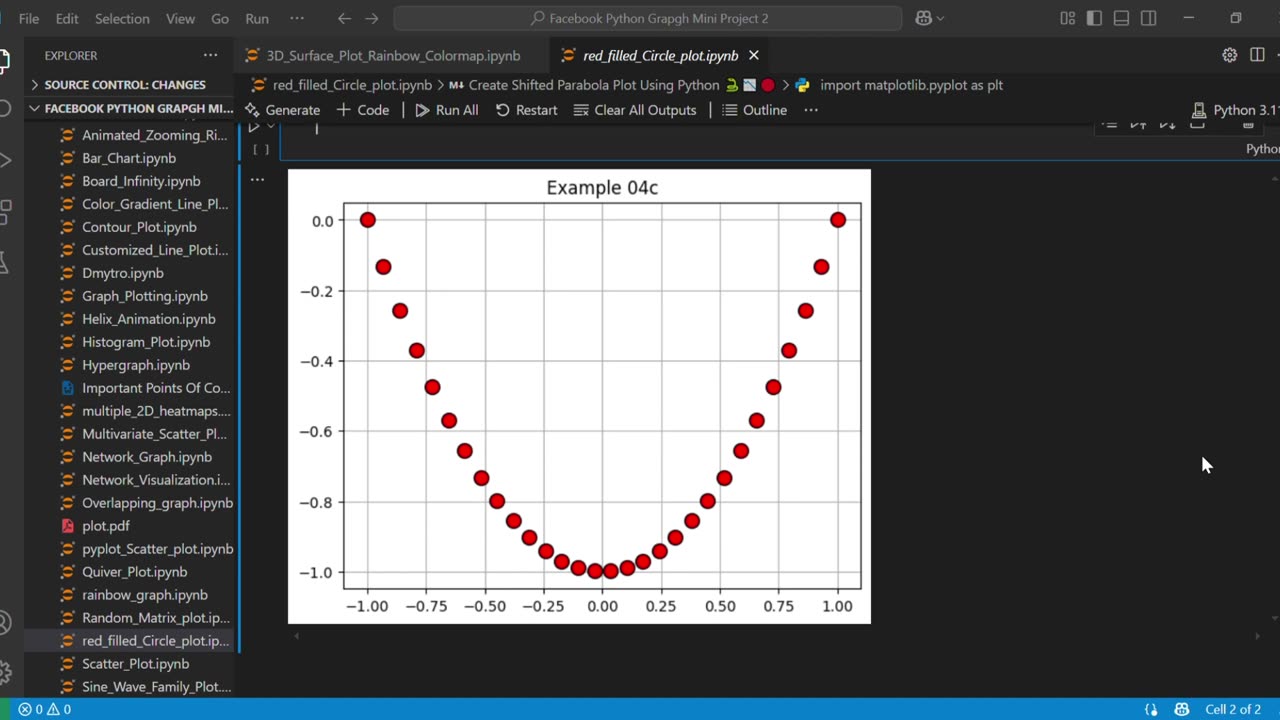
In this beginner-friendly tutorial, you'll learn how to graph shifted parabolas in Python using Matplotlib.
We’ll plot the function y = x² - 1, which is a simple parabola shifted downward, and customize the plot with gridlines, red circular markers, and a clean layout.
Perfect for math students, educators, or anyone learning Python plotting and data visualization.
🎯 What You’ll Learn:
How to plot mathematical functions in Python
How to create a shifted parabola using numpy
How to customize markers, colors, and grid in matplotlib
A practical example of visualizing equations with code
🧰 Libraries Used:
Python
NumPy
Matplotlib
📊 Ideal for math visualization, educational content, and Python learners!
👍 Like | 💬 Comment | 🔔 Subscribe for more Python graph tutorials!
#ShiftedParabola #MatplotlibTutorial #GraphingInPython #PythonMathPlot
#ParabolaPlotPython #PythonForBeginners #MatplotlibGraph
#PlotMathFunctions #yEqualsXSquaredMinusOne #PythonGraphTutorial
#DataVisualizationPython #PythonPlotting #EducationalPython
#LearnMatplotlib #PythonGraphExample #Codding #Python #MachineLearning
-
 0:36
0:36
AI Evolutionary Technology
1 day agoCreate Empty Recycle Bin with Python
11 -
 LIVE
LIVE
LFA TV
14 hours agoLFA TV ALL DAY STREAM - TUESDAY 9/2/25
938 watching -
 LIVE
LIVE
LIVE WITH CHRIS'WORLD
5 hours agoLIVE WITH CHRIS'WORLD - IT WORKED IN D.C. & IT WILL WORK IN CHICAGO
105 watching -
 40:44
40:44
Ohio State Football and Recruiting at Buckeye Huddle
5 hours agoOhio State Football: 10 Things We Learned From Rewatching the Texas Win
3.77K -
 LIVE
LIVE
Edge of Wonder
7 hours agoRemote Viewing 3I/ATLAS & Yellowstone’s Weird Anomalies
265 watching -
 1:08:47
TheCrucible
4 hours agoThe Extravaganza! EP: 30
78.2K8 -
 1:16:58
Kim Iversen
9 hours agoCOVID VACCINE HORROR: Fertility Destroyed & DNA Altered? | Nicolas Hulscher, MPH
44.1K96 -
 1:58:54
Wayne Allyn Root | WAR Zone
7 hours agoWAR Zone LIVE | 2 SEPTEMBER 2025
14.5K1 -
 1:01:05
Jeff Ahern
4 days ago $2.32 earnedFriday Freak out with Jeff Ahern
29K8 -
 1:51:40
Redacted News
4 hours agoHIGH ALERT! TRUMP IS COMING FOR CHICAGO, U.S. TROOPS PREPARING INVASION TO STOP MURDERS | REDACTED
126K218