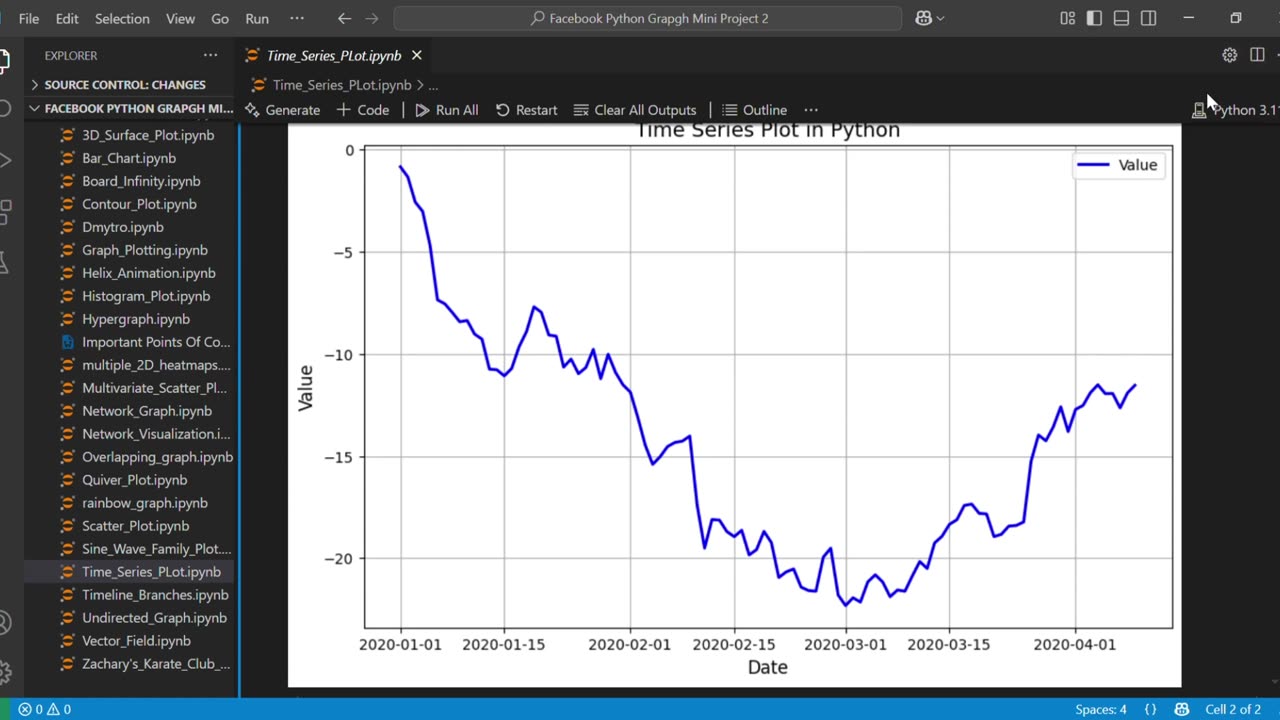
Create Stunning Time Series Graphs in Python
Create Stunning Time Series Graphs in Python | Easy Tutorial
📊 In this tutorial, you'll learn how to create stunning time series plots using Python and Matplotlib! Whether you're a beginner or brushing up your data visualization skills, this video walks you through step-by-step — from generating time series data to customizing your graph with labels, grids, and legends.
🎯 What you'll learn:
How to create a time series using pandas
How to use matplotlib to plot time-based data
Customizing plot appearance (colors, labels, title, grid, etc.)
Real-world tips for better data visualization
📌 Tools Used:
Python
Pandas
NumPy
Matplotlib
Perfect for data science, analytics, and anyone interested in Python plotting. No prior experience required!
🔔 Don’t forget to Like, Subscribe, and hit the bell icon for more beginner-friendly Python tutorials.
#TimeSeriesPlot #PythonPlotting #MatplotlibTutorial #Python #PythonDataVisualization #TimeSeriesInPython #DataVisualizationPython
#PythonForBeginners #MatplotlibTimeSeries #PandasTimeSeries
#PythonChartTutorial #PlotTimeSeriesPython #VisualizeDataPython
#LearnMatplotlib #PythonGraphTutorial #DataSciencePython
#PythonMatplotlibGuide
-
 0:36
0:36
AI Evolutionary Technology
1 day agoCreate Empty Recycle Bin with Python
11 -
 LIVE
LIVE
Man in America
6 hours agoTrump Demands Big Pharma Come Clean on Covid Shots w/ Dr. David Martin
1,255 watching -
 1:40:27
megimu32
2 hours agoOTS: Labor Day Sitcom Blowout - Tim, Ray, & Relatable Chaos!
12.2K2 -
 LIVE
LIVE
StevieTLIVE
2 hours agoWarzone Wins w/ FL Mullet Man
124 watching -
 1:04:01
BonginoReport
6 hours agoLefties Wish Death on Trump but He’s BACK! - Nightly Scroll w/ Hayley Caronia (Ep.125)
163K69 -

Tundra Tactical
3 hours ago $0.48 earnedWe Survived the Military… But Not This Basement
6.54K -
 20:12
20:12
Clownfish TV
11 hours agoDisney Needs MEN Back?! They ADMIT Star Wars and Marvel are DEAD!
9.35K28 -
 LIVE
LIVE
Anthony Rogers
10 hours agoEpisode 381 - Tim Kelleher
50 watching -
 1:01:42
The Nick DiPaolo Show Channel
7 hours agoTDS Hits New Level! | The Nick Di Paolo Show #1786
43.5K33 -
 1:02:27
Michael Franzese
5 hours agoFace to Face with a Former Chinatown Gangster Turned NYPD Detective
45K13