Plot a 2D Gaussian Field in Python | Quiver Plot Tutorial
How to Plot a 2D Gaussian Field in Python | Quiver Plot Tutorial
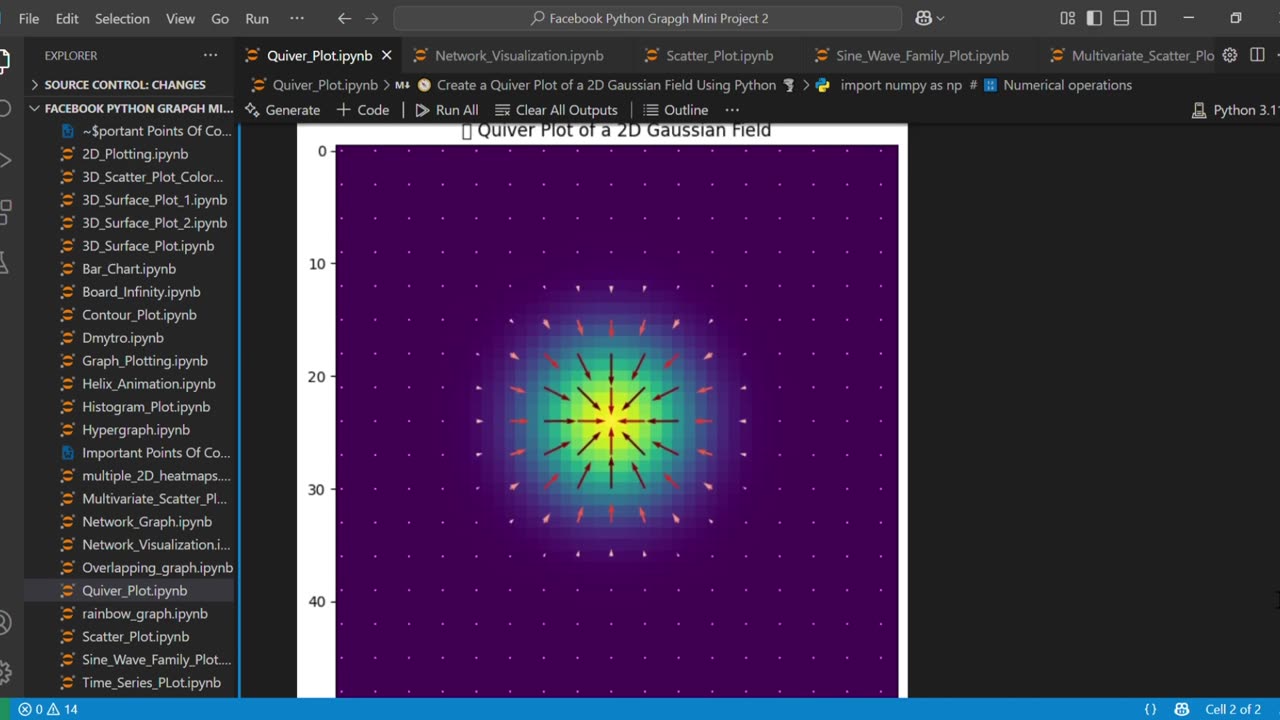
Welcome to this step-by-step Python tutorial where you'll learn how to visualize a 2D Gaussian field using Quiver Plots in Matplotlib! 🌟
In this video, we’ll cover:
✅ Creating a 2D Gaussian function in Python
✅ Generating a meshgrid for vector field visualization
✅ Computing gradients (dx, dy) using NumPy
✅ Plotting dynamic Quiver arrows to show gradient direction & strength
✅ Customizing the plot with colors, scales, and labels
By the end, you'll be able to plot beautiful vector fields for scientific computing, physics simulations, or machine learning applications!
👍 Like, Subscribe & Hit the Bell Icon to stay updated with more Python plotting tutorials!
💬 Got Questions? Drop them in the comments below!
#Python #DataVisualization #Matplotlib #QuiverPlot #Gradient #ScientificComputing #Physics #MachineLearning #CodingTutorial
-
 0:36
0:36
AI Evolutionary Technology
2 days agoCreate Empty Recycle Bin with Python
11 -
 LIVE
LIVE
LFA TV
4 hours agoLFA TV ALL DAY STREAM - WEDNESDAY 9/3/25
4,955 watching -
 LIVE
LIVE
MYLUNCHBREAK CHANNEL PAGE
2 hours agoHistory’s Most SHOCKING Claims?
419 watching -
 LIVE
LIVE
Caleb Hammer
2 hours agoThe First LGBT Divorce On Financial Audit
113 watching -
 LIVE
LIVE
Badlands Media
1 hour agoBadlands Daily: September 3, 2025 (#2)
3,323 watching -
 LIVE
LIVE
Jim Jordan
1 hour agoEurope’s Threat to American Speech and Innovation
485 watching -
 LIVE
LIVE
The State of Freedom
5 hours agoFLF: #16 Delivering the Truth Comes at a Cost w/ Joe Hoft
18 watching -
 31:01
31:01
Rethinking the Dollar
1 hour agoWe're In A NEW Monetary Reality! Xi & Putin Knows How This ENDS | Morning Check-In: Let's Talk...
5.97K -
 LIVE
LIVE
House Committee on Energy and Commerce
2 hours agoExamining Opportunities to Advance American Health Care through the Use of AI Technologies
19 watching -
 1:04:12
Crypto Power Hour
3 hours ago $0.19 earnedSmart Contracts & Fintech 101
4.94K5