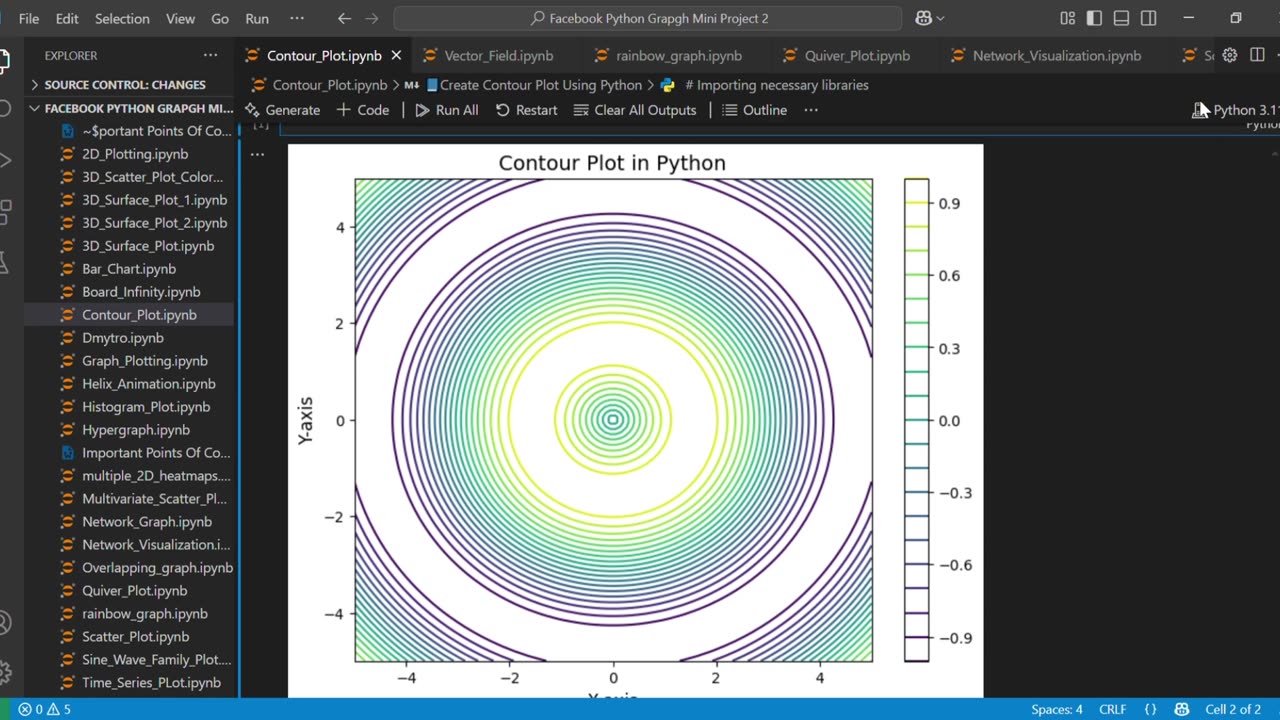
📘Create stunning Contour Plot Using Python
Loading comments...
-
 0:39
0:39
AI Evolutionary Technology
7 days agoHow to Create a Streamgraph in Python
1 -
 2:03:56
Benny Johnson
2 hours agoBOMBSHELL: Massive Judicial Corruption Scam That ALLOWED Black Killer to Murder in Charlotte EXPOSED
35.3K40 -
 13:24
13:24
Peter Boghossian
3 days agoWhy Can't TRANS People Answer This Simple Question, "What Is Trans?"
1903 -
 LIVE
LIVE
The Shannon Joy Show
1 hour ago🔥🔥Could Trump Trigger The Globalist Great Reset?🔥🔥
210 watching -
 LIVE
LIVE
Trumpet Daily
1 hour agoTrumpet Daily LIVE | Sept. 9, 2025
430 watching -
 27:46
27:46
Rethinking the Dollar
2 hours agoUS Jobs Report DECEPTION – Precious Metals Smell Blood (Fed To Cut BIG) | Morning Check-In: Let's Talk...
5.58K2 -
 1:00:08
VINCE
4 hours agoBREAKING: Trump Goes To 'War' In Chicago | Episode 121 - 09/09/25
146K133 -
 LIVE
LIVE
LFA TV
6 hours agoLFA TV ALL DAY STREAM - TUESDAY 9/9/25
4,664 watching -
 1:34:42
Dear America
4 hours agoTrump DESTROYS Dems: ‘Blood On Their Hands!’ — America Won’t Survive Without Law & Order”
84K49 -
 2:00:14
Nerdrotic
5 hours ago $2.87 earnedUFO Disclosure Hearing LIVE REACTION - Forbidden Frontier #116
27.9K7