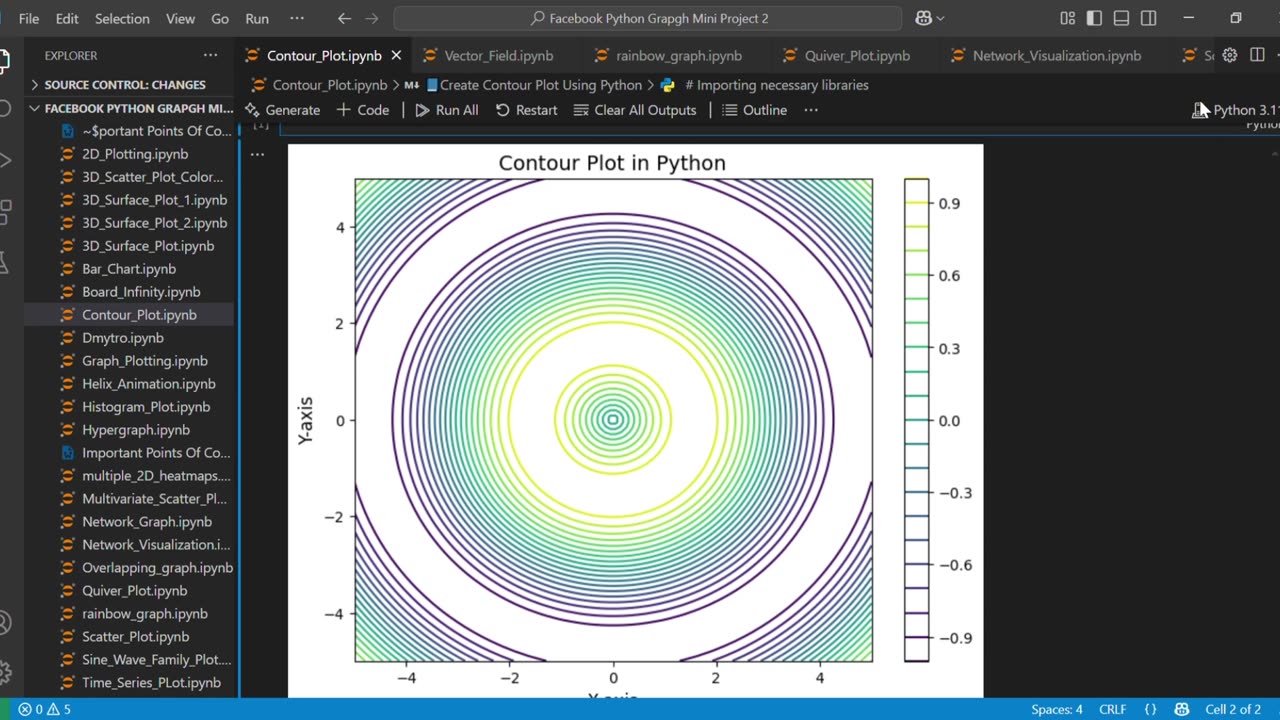
📘Create stunning Contour Plot Using Python
Loading comments...
-
 1:15
1:15
AI Evolutionary Technology
8 days agoCreating a Stunning Peacock Tail Pattern with Python & Matplotlib
41 -
 6:32
6:32
WhaddoYouMeme
15 hours ago $1.77 earnedChristians, These Reactions Should Disturb You
4.29K23 -
 9:59
9:59
Clownfish TV
14 hours agoWarner Bros and Paramount are MERGING?! | Clownfish TV
2.35K2 -
 19:19
19:19
World2Briggs
1 day ago $0.59 earnedTop 10 Amazing States With The Lowest Taxes.
4.26K1 -
 LIVE
LIVE
BEK TV
23 hours agoTrent Loos in the Morning - 9/16/2025
298 watching -
 LIVE
LIVE
The Bubba Army
22 hours agoDid Charlie Kirk's Killer, Confess On Discord? - Bubba the Love Sponge® Show | 9/16/25
2,367 watching -
 8:41
8:41
Zoufry
1 day agoInside The Cartels Training Camps for Assassins
5.17K1 -
 12:37
12:37
itsSeanDaniel
1 day agoFake Republican REFUSES to Stand Up for Charlie Kirk
12.1K35 -
 1:01:55
MTNTOUGH Podcast w/ Dustin Diefenderfer
21 hours agoJason Khalipa: American Men: Get Off the Couch and Rise Up Now | MTNPOD #133
20.4K45 -
 5:17
5:17
Blackstone Griddles
13 hours agoEasy Weeknight Meals: Creamy Parmesan Beef Pasta
11.7K4