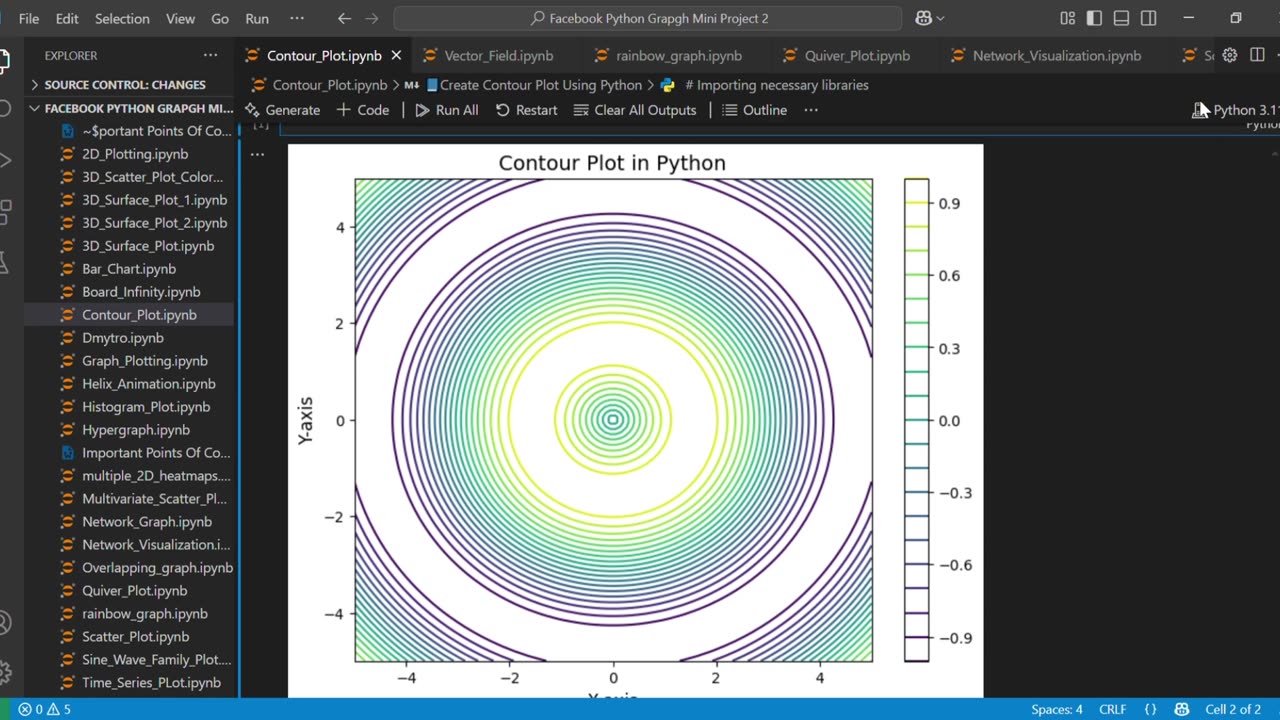
📘Create stunning Contour Plot Using Python
Loading comments...
-
 1:02
1:02
AI Evolutionary Technology
19 days agoLive Weather App in Python | BeautifulSoup & Web Scraping Tutorial
31 -
 5:17
5:17
Buddy Brown
1 day ago $0.57 earnedSomething BIBLICAL is Happening with the Earth's FREQUENCY! | Buddy Brown
7553 -
 3:12:38
Right Side Broadcasting Network
6 hours agoLIVE REPLAY: White House Press Secretary Karoline Leavitt Holds a Press Briefing - 10/1/25
97.6K53 -
 1:20:12
Russell Brand
4 hours agoFrank Turek on Charlie Kirk, Faith & Today’s Battle for Truth - SF643
105K42 -
 LIVE
LIVE
Jeff Ahern
1 hour agoNever Woke Wednesday with Jeff Ahern
159 watching -
 32:22
32:22
ArturRehi
2 hours agoDrone Wall, Blackouts, Assassinations — Russia Under Pressure
4K2 -
 1:59:29
The Charlie Kirk Show
3 hours agoShut It Down + End the ADL + The Baddest Bunny | Tim Pool | 10.1.2025
201K93 -
 57:39
57:39
Dear America
2 hours agoThe Government Is Closed And Netflix Wants Your Kids! + Revival Happens If We Keep Moving Forward
60.7K47 -

The White House
4 hours agoPress Secretary Karoline Leavitt Briefs Members of the Media, Oct. 1, 2025
34K16 -
 53:14
53:14
The Kevin Trudeau Show Limitless
5 hours agoKevin Trudeau Reveals the Crypto Secrets Only the Ultra-Rich Know
14K8