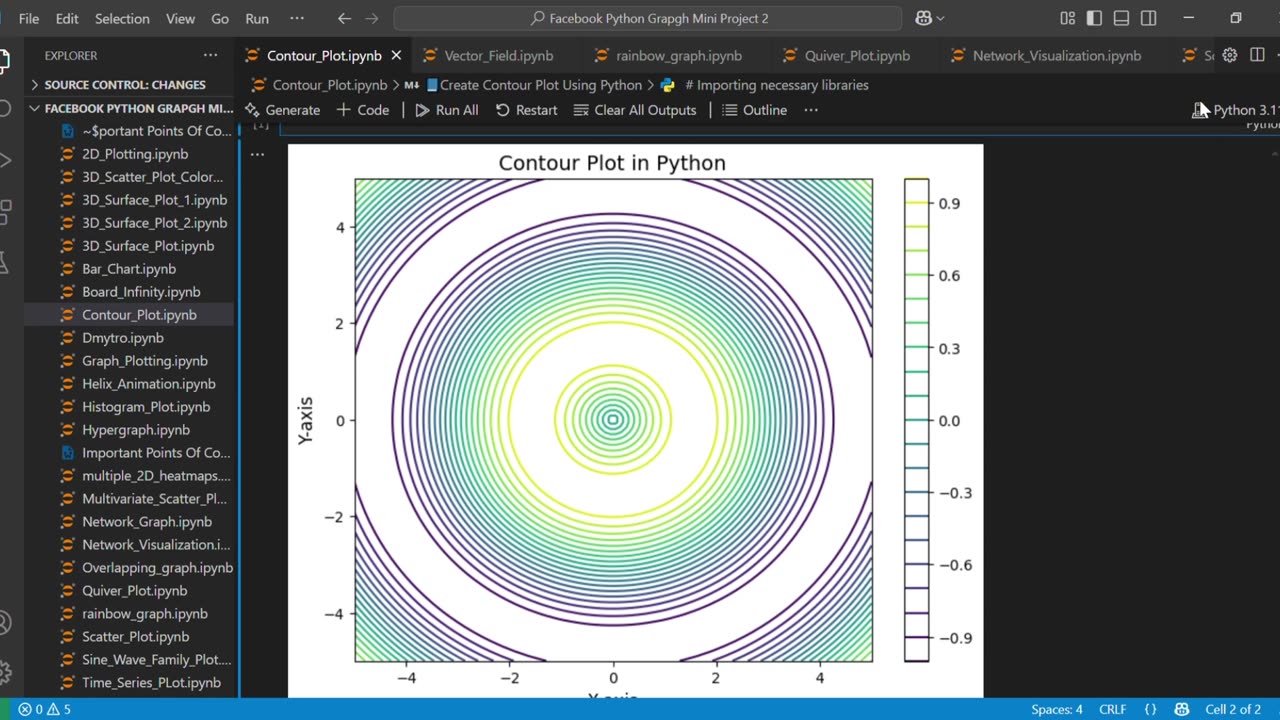
📘Create stunning Contour Plot Using Python
Loading comments...
-
 1:02
1:02
AI Evolutionary Technology
2 months agoLive Weather App in Python | BeautifulSoup & Web Scraping Tutorial
101 -
 LIVE
LIVE
Grant Cardone
4 hours agoHow to Buy Real Estate With NO Money Down (LIVE Training With Grant Cardone)
1,348 watching -
 LIVE
LIVE
AlaskanBallistics
11 hours agoShooting the WhisperStrike WT30 Live!
72 watching -
 19:53
19:53
MetatronHistory
18 hours agoRome VS Greece - Ultimate Clash of Civilizations Explained
38.7K9 -
 LIVE
LIVE
The Big Mig™
4 hours agoThe Big Mig Show's Greatest Hits w/ Americas Future, Karmageddon, Operation Gideon,..
102 watching -
 1:32:33
VapinGamers
3 hours ago $4.46 earnedTools of the Trade - EP12 The Art of Story Telling with MidnightinTheMountains - !rumbot !music
17.6K2 -
 LIVE
LIVE
SOLTEKGG
2 hours ago🔴LIVE - Battlefield 6 - Going Pro in RED SEC
186 watching -
 LIVE
LIVE
Midnight In The Mountains™
4 hours agoThe Midnights Play Arc Raiders | Loot Scoot and KILL | Crypto Wallet up n running GO JOIN THE BETA!
97 watching -
 53:25
53:25
X22 Report
5 hours agoMr & Mrs X - Trump Is Using The Same Tactic As Our Founding Fathers To Rebuild America - EP 17
89K23 -
 LIVE
LIVE
PudgeTV
2 hours ago🟣 Arc Raiders - Gaming on Rumble | Going Topside w My Daughter’s Husband
79 watching