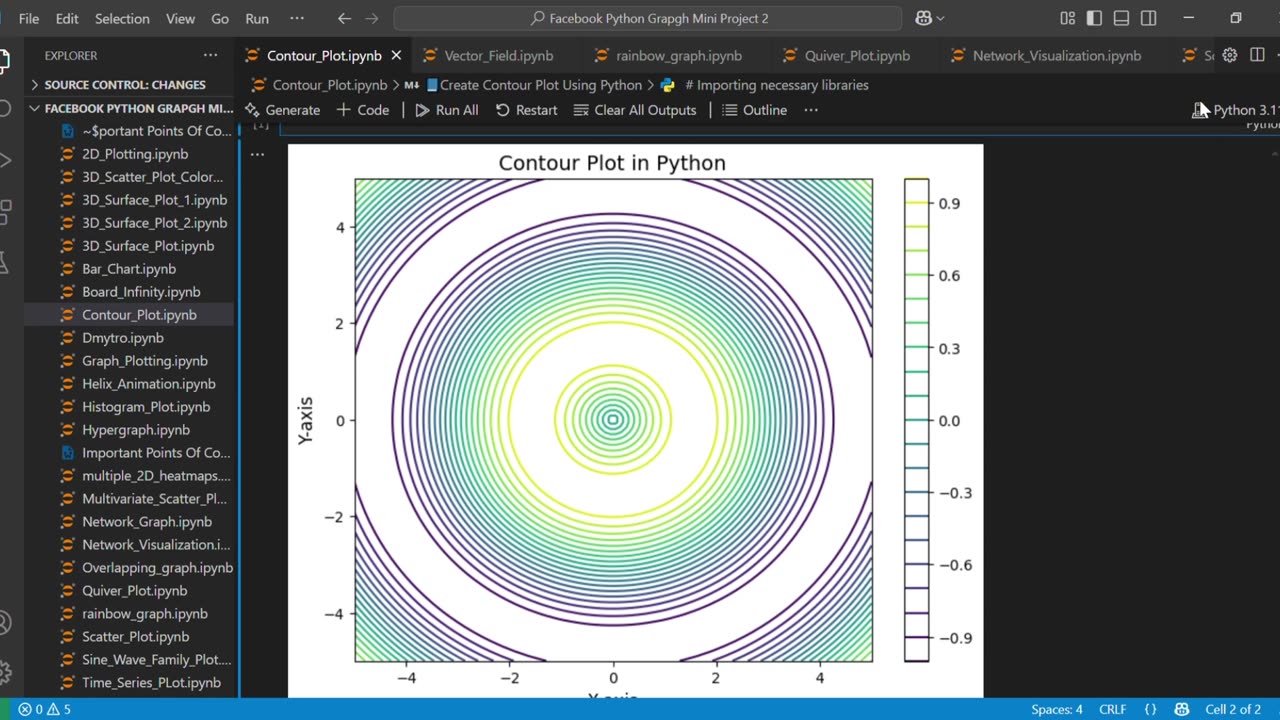
📘Create stunning Contour Plot Using Python
Loading comments...
-
 0:20
0:20
AI Evolutionary Technology
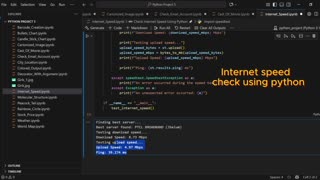
1 month agoUsing Python to Analyze Your Internet Connection
121 -
 LIVE
LIVE
The Charlie Kirk Show
2 hours agoJUDGMENT DAY 2025: The Election Results Stream
7,431 watching -
 LIVE
LIVE
MattMorseTV
3 hours ago $30.32 earned🔴Election Day LIVE COVERAGE.🔴
1,845 watching -
 LIVE
LIVE
Sarah Westall
3 hours agoGrooming is Protected and Encouraged by the System – Michelle Peterson and Mike Adamovich
90 watching -
 LIVE
LIVE
Akademiks
42 minutes agoKendrick tries to Flip the Bots on DRAKE? WHo Beats Jay z in a verzuz. Blueface finally free!
937 watching -
 LIVE
LIVE
Professor Nez
6 hours ago🚨ELECTION NIGHT 2025 LIVE! Massive Upsets Brewing in New York, New Jersey & Virginia!
170 watching -
 LIVE
LIVE
Due Dissidence
9 hours agoLIVE: ELECTION RESULTS From NYC, NJ, and VA - Trump Approval CRATERS, Kash's Private Jet CRASH OUT
1,294 watching -
 12:50
12:50
Demons Row
2 hours ago $0.46 earnedBikers of New Jersey 💀🏍️ Pagans, Thunder Guards, and Thug Riders
3.88K1 -
 42:31
42:31
Stephen Gardner
5 hours ago🔥Old Obama Video RESURFACES - His Own Words CONDEMNED Him! Trump Gains MASSIVE Momentum!!
11.3K15 -

LFA TV
23 hours agoLIVE & BREAKING NEWS! | TUESDAY 11/4/25
159K33