🧭 Create Plot of a 2D Vector Field using Python 🌀📊
5 months ago
10
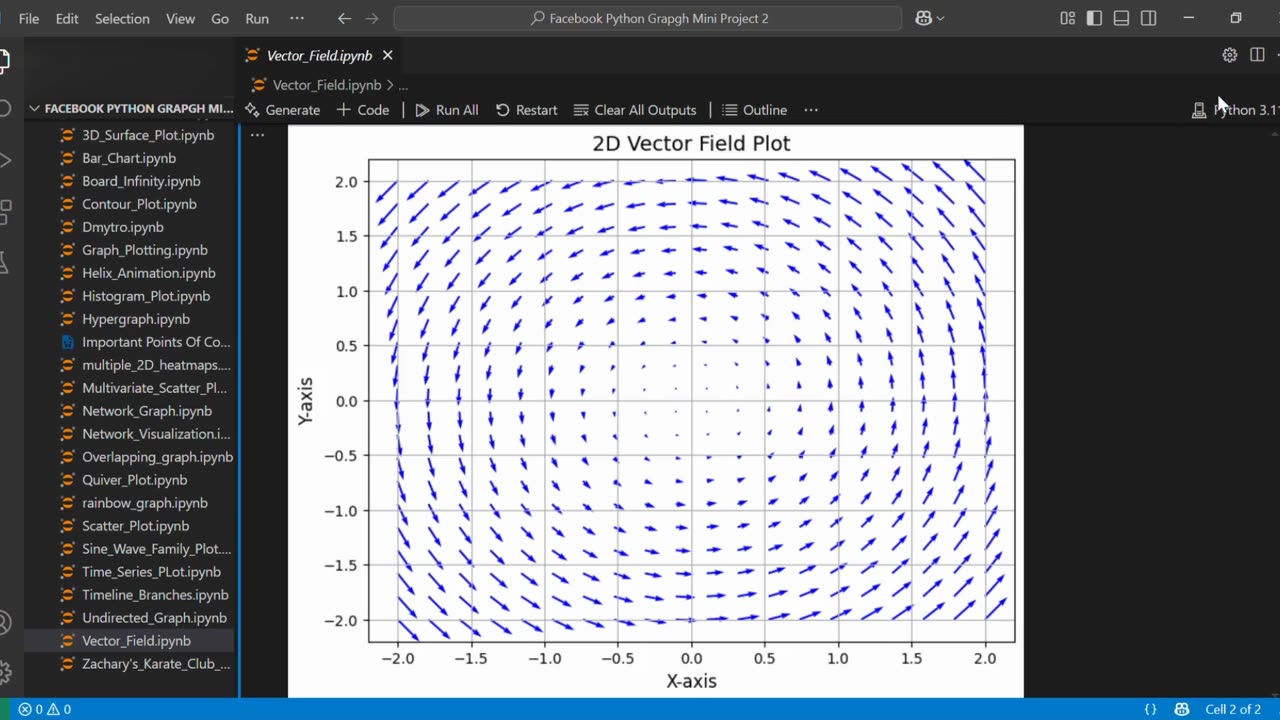
🧭 Create Plot of a 2D Vector Field using Python 🌀📊
Visualize the direction and magnitude of vectors across a 2D plane using Python’s powerful libraries like Matplotlib and NumPy. This type of plot is ideal for representing fields like wind flow, electric fields, or gradients in physics and engineering.
Loading comments...
-
 1:02
1:02
AI Evolutionary Technology
2 months agoLive Weather App in Python | BeautifulSoup & Web Scraping Tutorial
101 -
 16:38
16:38
MetatronGaming
14 hours agoAnno 117 Pax Romana looks INCREDIBLE
76.5K9 -
 3:25:55
DillyDillerson
3 hours agoCAN'T SLEEP | Solo Raids | Trying to level up my workshop | Tips and help are welcome!
4.61K -
 LIVE
LIVE
DynastyXL
3 hours ago🔴 LIVE NOW – ARC RAIDING - BADLY! - NEW RUMBLE WALLET - THOUGHTS?
125 watching -
 2:20:13
Side Scrollers Podcast
21 hours agoVoice Actor VIRTUE SIGNAL at Award Show + Craig’s HORRIBLE Take + More | Side Scrollers
70.6K20 -
 LIVE
LIVE
EXPBLESS
1 hour agoShowcasing New Game | (Where Winds Meet) #RumblePremium
33 watching -
 LIVE
LIVE
Boxin
2 hours agolets BEAT! Kingdom Hearts!
52 watching -
 18:49
18:49
GritsGG
17 hours agoI Was Given a Warzone Sniper Challenge! Here is What Happened!
22.2K2 -
 19:02
19:02
The Pascal Show
1 day ago $6.30 earnedNOT SURPRISED! Pam Bondi Is Lying To Us Again About Releasing The Epstein Files
28.9K21 -
 6:05
6:05
Blabbering Collector
21 hours agoRowling On Set, Bill Nighy To Join Cast, HBO Head Comments On Season 2 Of Harry Potter HBO!
25.4K4