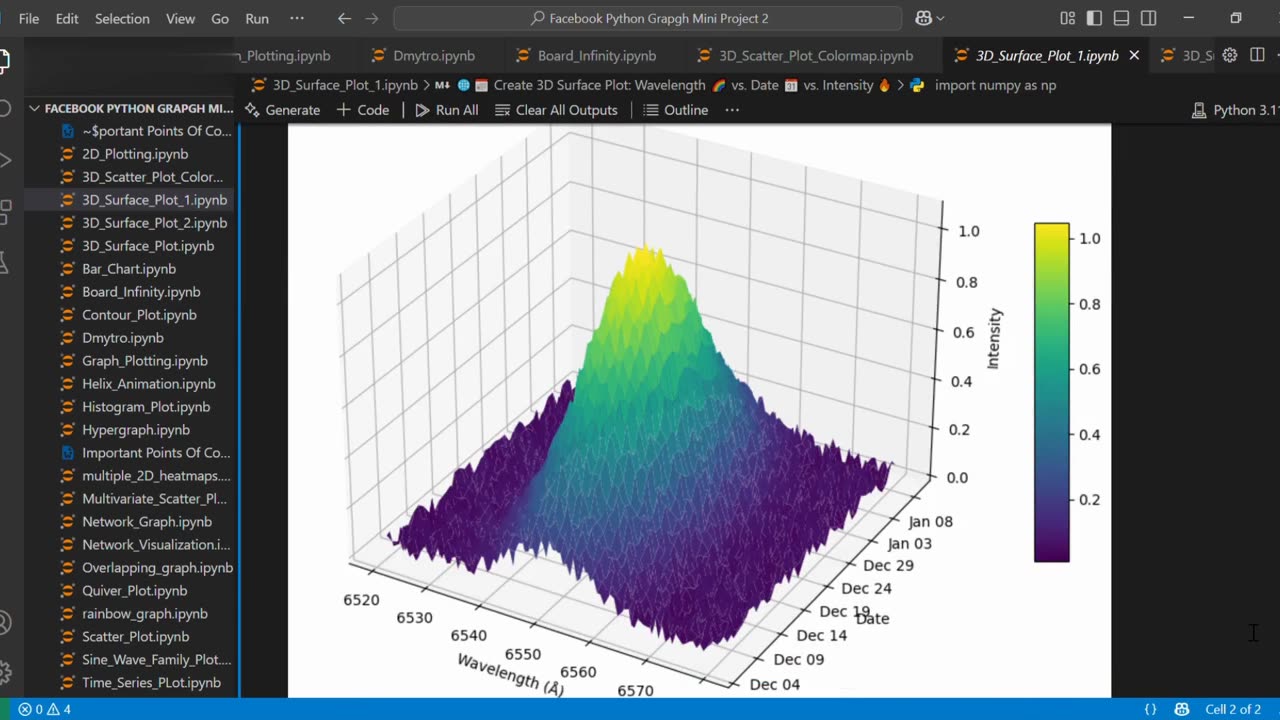
🌐📅 Create 3D Surface Plot: Wavelength 🌈 vs. Date 📆 vs. Intensity 🔥
2 months ago
6
The phrase Create 3D Surface Plot: Wavelength 🌈 vs. Date 📆 vs. Intensity 🔥"** refers to visualizing how light intensity varies over time and across different wavelengths. A 3D surface plot helps reveal trends or patterns in spectral data across dates, offering insights into changes in energy distribution or observations over time.
Loading comments...
-
 1:05
1:05
AI Evolutionary Technology
3 days agoCreate Your Own Python Decorator | Repeat Functions Like a Pro
7 -
 12:29
12:29
The Quartering
13 hours agoFBI Admits ACCOMPLICE In Charlie Kirk Assassination! Ring Doorbell Camera Footage & Phone Calls!
66.6K250 -
 30:41
30:41
Crowder Bits
1 day agoEXCLUSIVE: Charlie Kirk Eyewitness Details Shooting "Sacrifice Your Life For What You Believe In."
23.3K43 -
 4:14
4:14
The Rubin Report
1 day agoDave Rubin Shares Behind-the-Scenes Story of What Charlie Kirk Did for Him
49K25 -
 1:58:58
Badlands Media
1 day agoDevolution Power Hour Ep. 389: Psyops, Patsies, and the Information War
93.2K106 -
 2:13:55
Tundra Tactical
8 hours ago $11.59 earnedTundra Talks New Guns and Remembers Charlie Kirk On The Worlds Okayest Gun Show Tundra Nation Live
37.7K4 -
 1:45:08
DDayCobra
10 hours ago $37.97 earnedDemocrats Caught LYING Again About Charlie Kirk's KILLER
72.8K80 -
 19:23
19:23
DeVory Darkins
11 hours ago $16.74 earnedShocking Update Released Regarding Shooter's Roommate as Democrats Issue Insane Response
52.1K160 -
 19:53
19:53
Stephen Gardner
13 hours ago🔥EXPOSED: Charlie Kirk Shooter's Trans Partner Tells FBI EVERYTHING!
67.8K332 -
 2:47:25
BlackDiamondGunsandGear
9 hours agoAfter Hours Armory / RIP Charlie Kirk / What we know
44K7