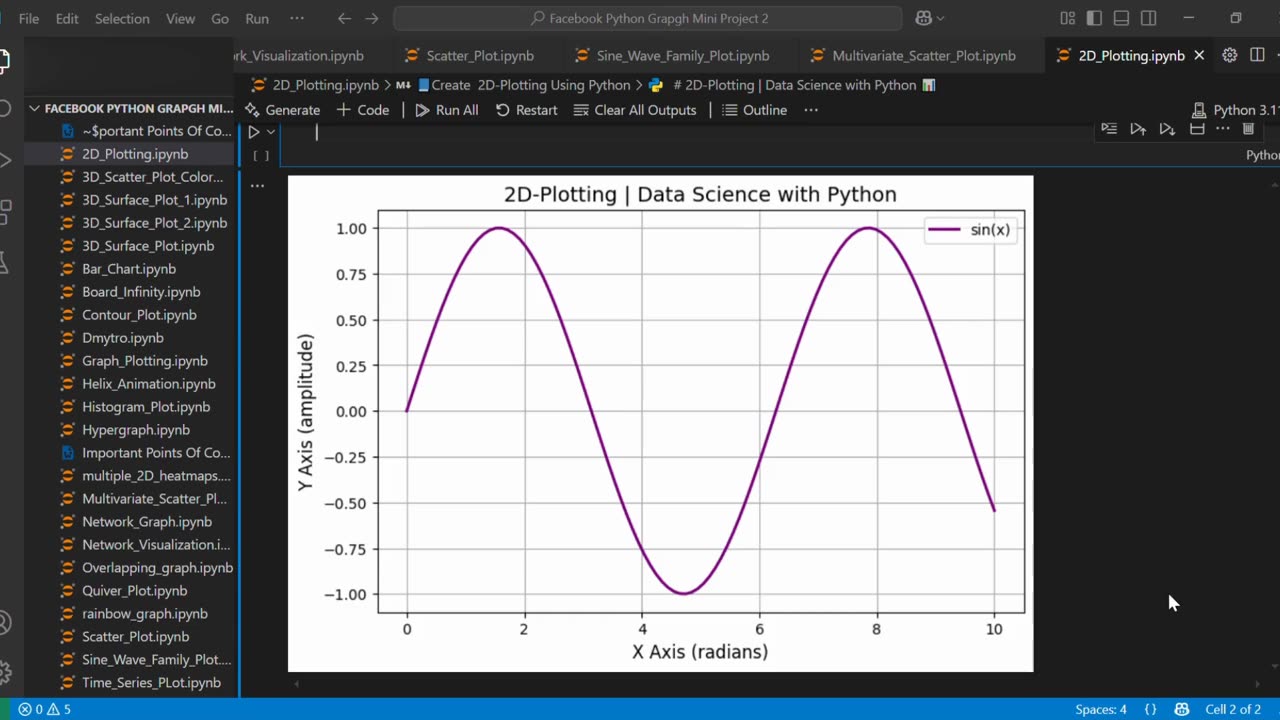
🔷 Create 2D-Line Plot Using Python 📈🐍
Loading 1 comment...
-
 0:19
0:19
AI Evolutionary Technology
12 days agoCreate Turtle Graphics Using Python
81 -
 9:11
9:11
Faith Frontline
13 hours agoTucker Carlson SHOCKED As Cliffe Knechtle Reveals God’s Chosen People
2.1K3 -
 23:10
23:10
Jasmin Laine
15 hours agoCTV Host Visibly UNCOMFORTABLE As Guest Calls Canadians RACIST—Poilievre Leaves Them SPEECHLESS
3.69K4 -
 20:18
20:18
Fit'n Fire
16 hours ago $0.29 earned*NEW* CZ P10C OR Ported -- First 500 Rounds
2.29K -
 14:41
14:41
Nate The Lawyer
1 day ago $0.66 earnedWhy Hasn’t Raja Jackson Been Arrested Yet?
4.04K13 -
 6:04
6:04
Buddy Brown
2 days ago $1.21 earnedEugene’s SICK Newspaper Cover is a WARNING to Us All! | Buddy Brown
6.99K9 -
 16:23
16:23
Actual Justice Warrior
1 day agoMom Sucker Punched By Repeat Offender In Chicago
11K29 -
 56:28
56:28
Professor Nez
1 day ago🚨Not Only is Epstein NOT Going Away… It Just Got Worse!
25K25 -
 8:09
8:09
MattMorseTV
17 hours ago $11.19 earnedTrump scores 17th CONSECUTIVE Supreme Court VICTORY.
76.7K60 -
 2:11:25
Side Scrollers Podcast
19 hours agoUK JAILS TV WRITER FOR WRONG THINK + TWITCH ALLOWS CYBERSTALKING + MORE | SIDE SCROLLERS LIVE
34.9K10