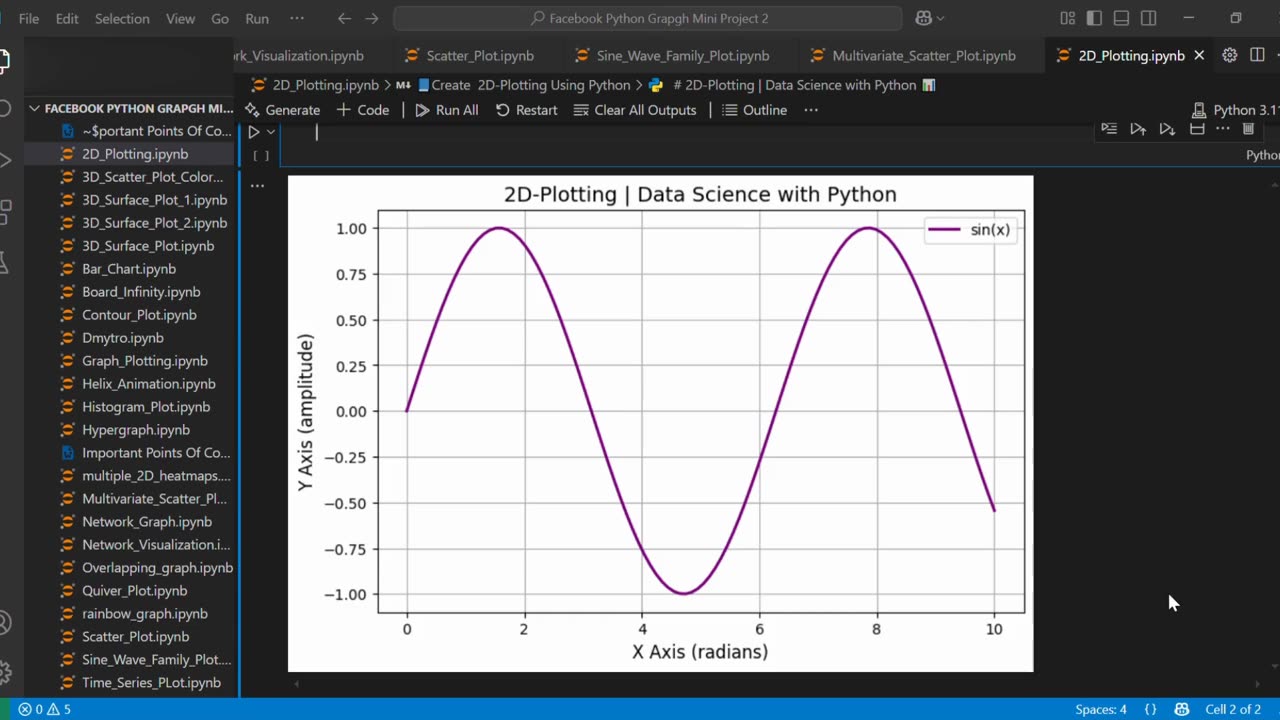
🔷 Create 2D-Line Plot Using Python 📈🐍
Loading 1 comment...
-
 1:06
1:06
AI Evolutionary Technology
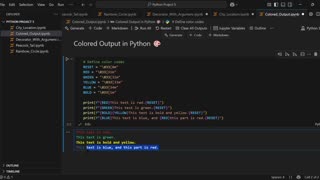
19 days agoAdd Stunning Colors to Your Python Console | Text Styling Made Easy
7 -
 15:42
15:42
Nicholas Bowling
14 hours ago $1.79 earnedCharlie’s MURDER Sparks COLLEGE STUDENTS to Boldly Preach the Gospel!
8.88K15 -
 40:10
40:10
Uncommon Sense In Current Times
17 hours ago $1.52 earnedDeconstruction of Christianity | Tim Barnett on Truth, Faith & the Crisis in Today’s Church
22K2 -
 LIVE
LIVE
Total Horse Channel
12 hours ago2025 Quarter Horse Congress * Celeste Center * Wednesday October 1st
94 watching -
 LIVE
LIVE
The Bubba Army
22 hours agoGOVERNMENT SHUTDOWN! - Bubba the Love Sponge® Show | 10/01/25
2,121 watching -
 7:22
7:22
Adam Does Movies
19 hours ago $0.69 earnedThe Smashing Machine - Movie Review
15.8K1 -
 5:15
5:15
Blackstone Griddles
13 hours agoCreamy Cajun Linguine with Bruce Mitchell on the Blackstone Griddle
21.9K1 -
 9:18
9:18
Freedom Frontline
18 hours agoMarco Rubio DESTROYS Stephanopoulos And Exposes USAID Scam
14.7K13 -
 0:39
0:39
OfficialJadenWilliams
4 days agoRealizing you're stuck in the Back Rooms
19K -
 9:14
9:14
The Art of Improvement
1 day ago $0.81 earnedHow to Stop Overthinking
13.3K