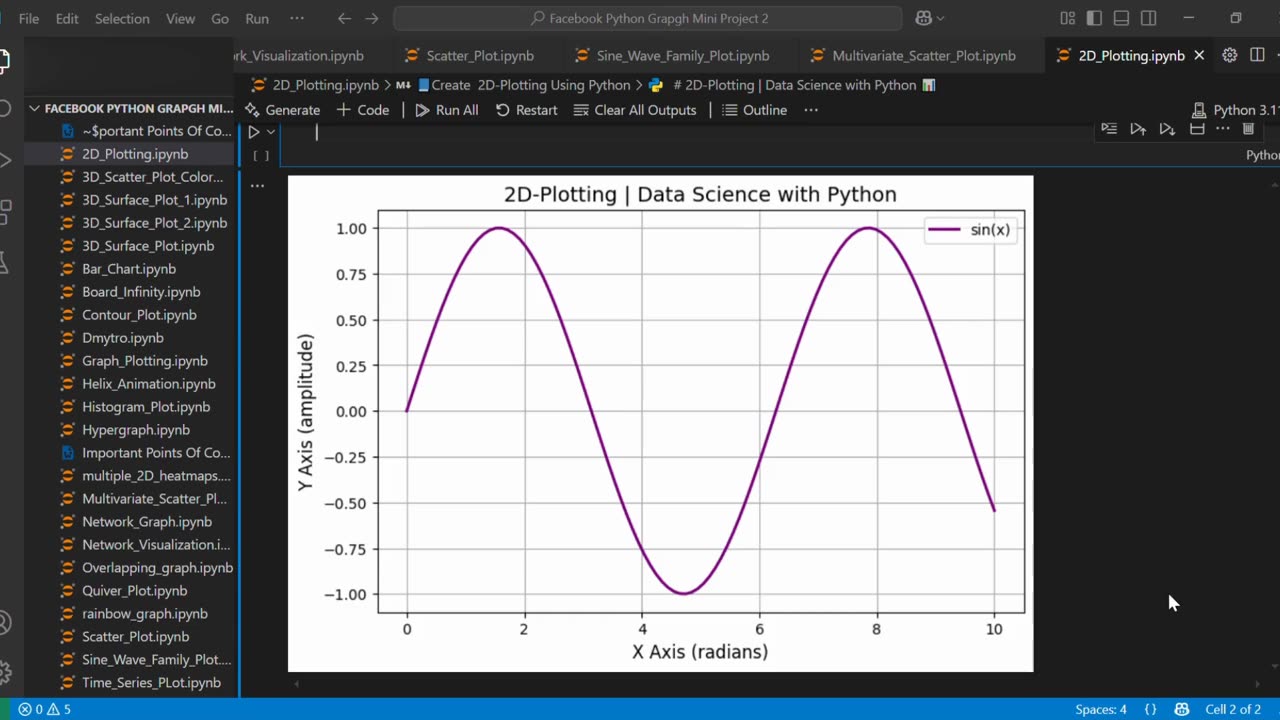
🔷 Create 2D-Line Plot Using Python 📈🐍
Loading 1 comment...
-
 0:16
0:16
AI Evolutionary Technology
1 month agoCreate Email Check Account Services Using Python
9 -

SpartakusLIVE
6 hours agoTeam BUNGULATORS || From HUGE WZ DUBS to TOXIC ARC BETRAYALS
97.6K2 -
 LIVE
LIVE
BlackDiamondGunsandGear
2 hours agoAre You that guy? / Carrying a Pocket Pistol /After Hours Armory
331 watching -
 LIVE
LIVE
Camhigby
3 hours agoLIVE - Riot Watch Portland, DC, NC
217 watching -
 2:54:58
CAMELOT331
5 hours agoYouTube Just Told Me I OWE THOUSANDS $ TO THEM... update
20.2K2 -
 2:00:53
Tundra Tactical
12 hours ago $0.89 earned🛑LIVE AT 9PM CST!! Your Government Hates Your Guns : DOJ Holds Firm On National FIREARMS ACT
13.3K -
 LIVE
LIVE
DLDAfterDark
3 hours ago $1.16 earnedAre YOU The Guy That Ruins Thanksgiving?? - God Guns & Gear
309 watching -
 2:58:31
NewsTreason
4 hours agoDECLAS w/ Rambo & Dave: Nuremberg 2.0 | MTG Exits Stage Left | Mamdani Psyop Confirmed, 8pm EST
61.8K59 -
 LIVE
LIVE
meleegames
4 hours agoSONG REQUESTS CLOSED - Melee Music - Beat Hazard 3 - Devil Inside
234 watching -
 2:13:31
The Connect: With Johnny Mitchell
11 hours ago $1.62 earnedIs Garth Brooks A Serial Killer? Exposing The Dark Secrets Of Country Music's Biggest Star
10.8K2