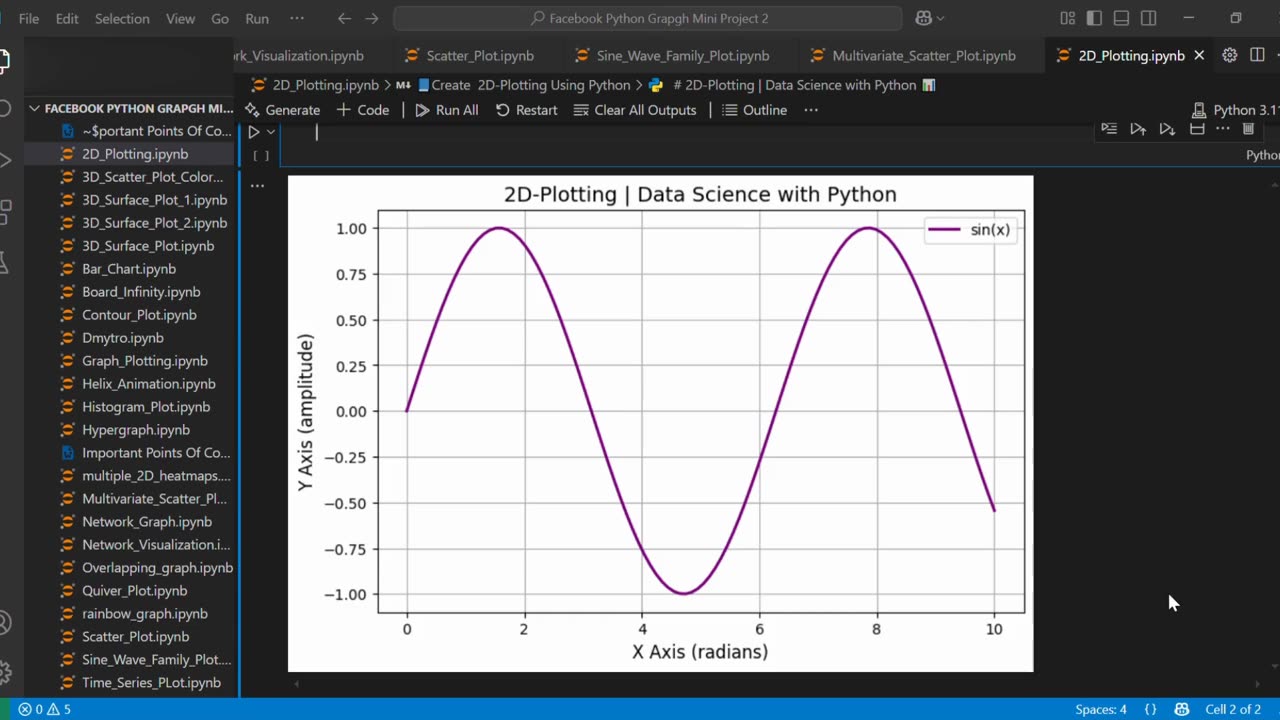
🔷 Create 2D-Line Plot Using Python 📈🐍
Loading 1 comment...
-
 0:20
0:20
AI Evolutionary Technology
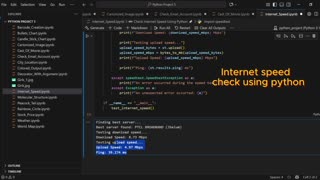
1 month agoUsing Python to Analyze Your Internet Connection
121 -
 56:36
56:36
The Rubin Report
2 hours agoFox Hosts Stunned by Piers Morgan’s Dark Prediction for NYC Under Zohran Mamdan
13.5K15 -
![GRAY ZONE DEVLOG FOR .3.5 UPDATE!!! [RGMT CONTENT Mgr. | RGMT GL | GZW CL]](https://1a-1791.com/video/fww1/11/s8/1/0/K/B/w/0KBwz.0kob-small-GRAY-ZONE-DEVLOG-FOR-.3.5-U.jpg) LIVE
LIVE
XDDX_HiTower
33 minutes agoGRAY ZONE DEVLOG FOR .3.5 UPDATE!!! [RGMT CONTENT Mgr. | RGMT GL | GZW CL]
49 watching -
 LIVE
LIVE
LFA TV
15 hours agoLIVE & BREAKING NEWS! | TUESDAY 11/4/25
3,972 watching -
 LIVE
LIVE
The Shannon Joy Show
1 hour agoICE Brutality In Evanston, Illinois Sparks New Outrage * GOP Seeks New FISA Re-Authorization * Are Tucker Carlson & Nick Fuentes Feds?
232 watching -
 LIVE
LIVE
The Mel K Show
1 hour agoA Republic if You Can Keep It-Americans Must Choose 11-04-25
534 watching -
 LIVE
LIVE
Grant Stinchfield
1 hour agoThe Mind Meltdown: Are COVID Shots Fueling America’s Cognitive Collapse?
134 watching -
 1:00:46
VINCE
4 hours agoThe Proof Is In The Emails | Episode 161 - 11/04/25
146K115 -
 2:12:22
Benny Johnson
2 hours ago🚨Trump Releases ALL Evidence Against James Comey in Nuclear Legal BOMBSHELL! It's DARK, US in SHOCK
77.7K26 -
 2:04:05
Badlands Media
11 hours agoBadlands Daily: November 4, 2025
58.6K8