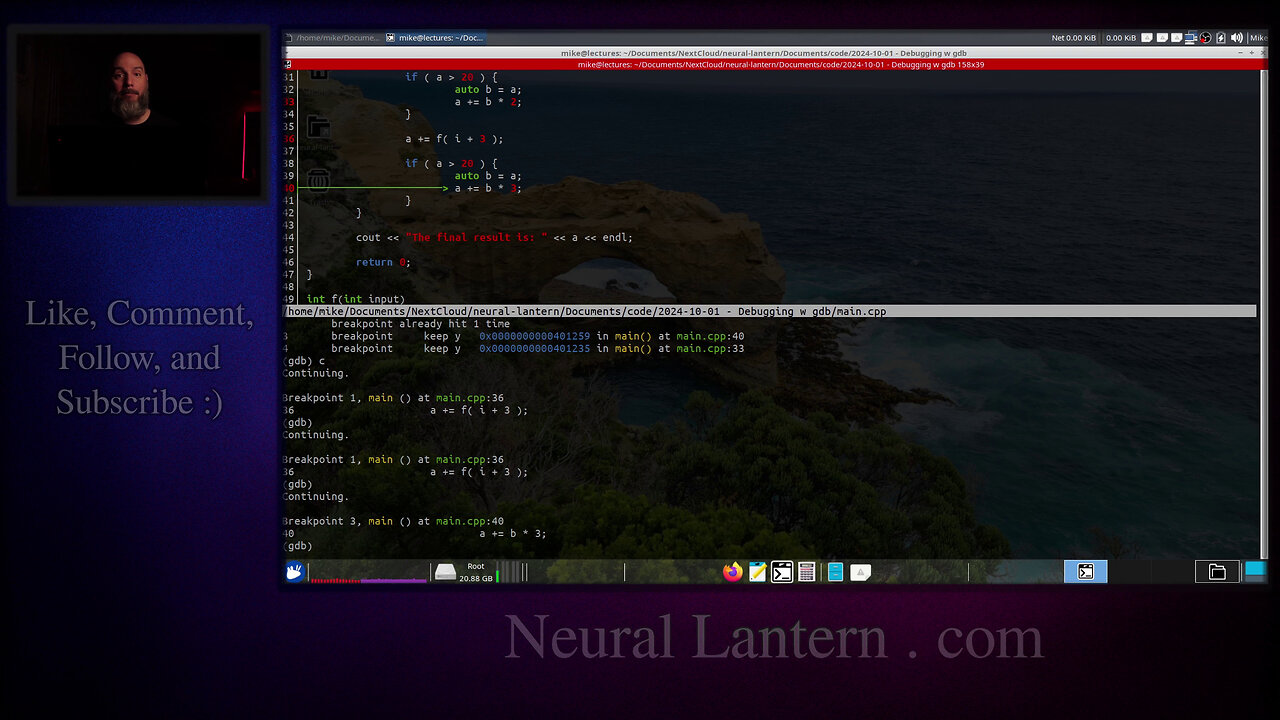
Master CGDB: Boost Your Debugging with GDB's Curses Interface in Terminal
Hey coders! In this video, I'm diving into CGDB, a powerful curses layer on top of GDB that makes terminal debugging a breeze. See your source code and breakpoints side-by-side in one clean interface. I'll walk you through setup, breakpoints, and why CGDB rocks for C++, C, and assembly projects. Watch my GDB video first for the basics (link in comments)! If you dig this, subscribe and drop a comment for more coding tips. Let's debug smarter! #CGDB #GDB #Debugging #Coding
Introduction to CGDB 00:00:00
Recommendation to Watch GDB Video 00:00:05
Explanation of CGDB and Curses 00:00:23
Building and Running CGDB 00:01:03
CGDB Interface Overview 00:01:56
Setting Breakpoints in CGDB 00:02:18
Managing Breakpoints 00:02:53
Benefits of CGDB 00:03:47
Closing Remarks and Subscription Request 00:04:00
Call for Comments and Suggestions 00:05:30
Thanks for watching!
Find us on other social media here:
- https://www.NeuralLantern.com/social
Please help support us!
- Subscribing + Sharing on Social Media
- Leaving a comment or suggestion
- Subscribing to our Blog
- Watching the main "pinned" video of this channel for offers and extras
-
 2:51:22
Laura Loomer
6 hours agoEP153: DEPORT MAMDANI!
44.5K47 -
 1:03:39
Flyover Conservatives
1 day agoAre ‘Aliens’ Really Demons? The Coming Digital ID System - Dr. Stella Immanuel; Frequencies of Control - Leigh Dundas | FOC Show
44.2K7 -
 4:36:58
Drew Hernandez
22 hours agoINCOMING: IMMINENT EBT APOCALYPSE IS UPON US?!
35.5K14 -
 25:47
25:47
Robbi On The Record
2 days ago $6.40 earnedExposing the OnlyFans Industry (Agency Edition)
40.1K14 -
 12:15:31
Dr Disrespect
17 hours ago🔴LIVE - DR DISRESPECT - BATTLEFIELD 6 - REDSEC LAUNCH - BATTLE ROYALE
205K24 -
 38:15
38:15
Scammer Payback
11 hours agoThe People's Call Center 2025
32.5K6 -
 50:10
50:10
Sarah Westall
6 hours agoARPA-H and the Weaponized Architecture for Total Dominance & Surveillance w/ Alix Mayer
36.2K8 -
 LIVE
LIVE
SpartakusLIVE
18 hours agoREDSEC BATTLE ROYALE || Battlefield 6 w/ The Boys
312 watching -
 2:42:11
DLDAfterDark
6 hours ago $0.01 earnedDLD Live! The Return of Red Dawn - Glock "V" Talk - Sighting In Your Optics & Sights
12.3K2 -
 33:50
33:50
Producer Michael
12 hours agoInside a FORTRESS Containing $2BILLION in Gold and Silver!
18.6K5