Create Streamgraph Using Python
2 months ago
2
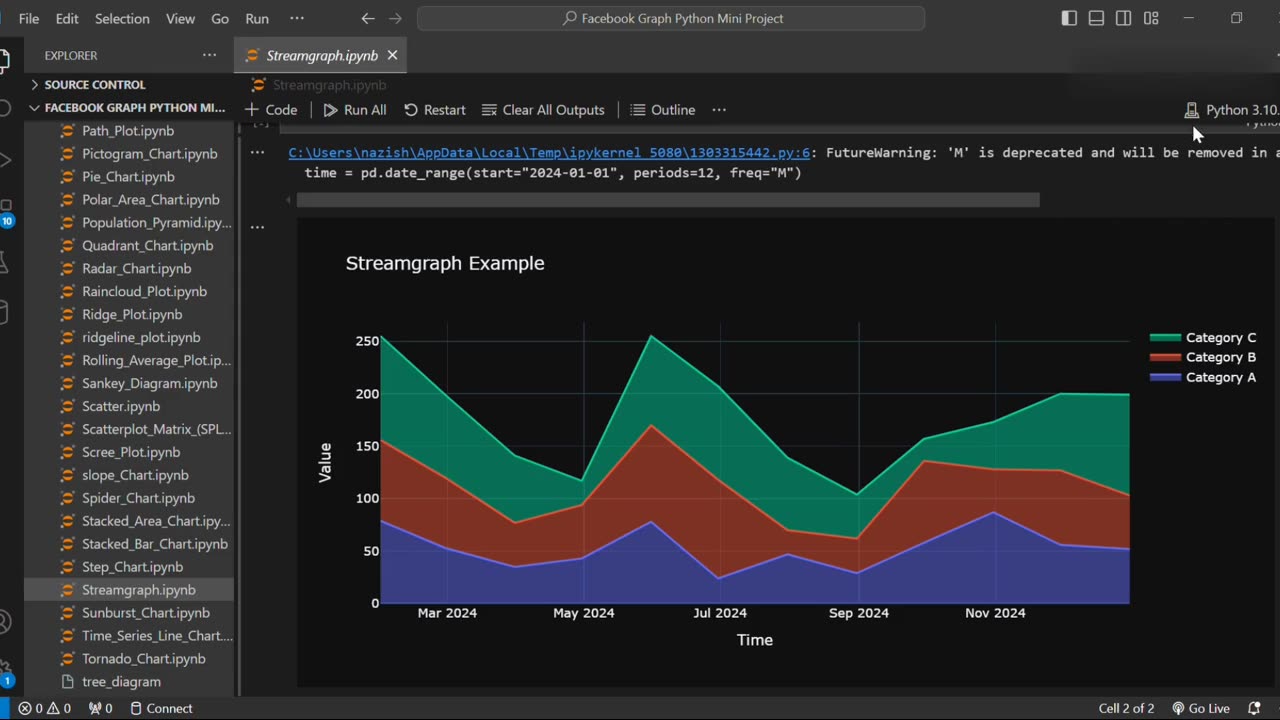
Create Streamgraph Using Python | Data Visualization Tutorial
Want to visualize changes in data over time with a smooth and flowing design? 🌊
In this tutorial, you'll learn how to create stunning Streamgraphs using Python with libraries like Matplotlib and Plotly.
📌 What You’ll Learn:
What a streamgraph is
When and why to use streamgraphs
Step-by-step guide to creating a streamgraph in Python
Customizing colors, labels, and layout for better insights
Perfect for time series and category-based data! 📈
Loading comments...
-
 0:36
0:36
AI Evolutionary Technology
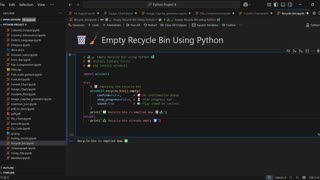
4 days agoCreate Empty Recycle Bin with Python
11 -
 LIVE
LIVE
Nerdrotic
1 hour agoUK Has Fallen, Hollywood DOOM, DC Dysfunction | Friday Night Tights 370
1,576 watching -
 UPCOMING
TundraTactical
2 hours agoFudd Finder : 11 Questions Second Amendment Questions (And Roasts) to Ask Your Friends
14 -
 UPCOMING
Silver Dragons
1 hour agoGold Price NEW ALL TIME HIGH - $5,000 GOLD NEXT?
44 -
 LIVE
LIVE
LFA TV
10 hours agoLFA TV ALL DAY STREAM - FRIDAY 9/5/25
1,405 watching -
 13:43
13:43
The Kevin Trudeau Show Limitless
2 days agoClassified File 3 | Kevin Trudeau EXPOSES Secret Society Brainwave Training
83.9K16 -
 1:11:24
vivafrei
4 hours agoDearborn Heights Police Have Been CONQUERED! Gender Madness on PASSPORTS! Canada Stuff & MORE!
75K26 -
 1:44:43
The Quartering
3 hours agoConservative Scam Busted, Black Fatigue Hits Airlines, Kimmel Meltdown
96.5K33 -
 LIVE
LIVE
Tudor Dixon
34 minutes agoRFK Jr., Big Pharma, and the Hidden Risks of SSRIs in Pregnancy | The Tudor Dixon Podcast
62 watching -
 LIVE
LIVE
Dr Disrespect
5 hours ago🔴LIVE - DR DISRESPECT - CRONOS: The New Dawn - FIRST IMPRESSIONS
1,404 watching