Create Streamgraph Using Python
5 months ago
10
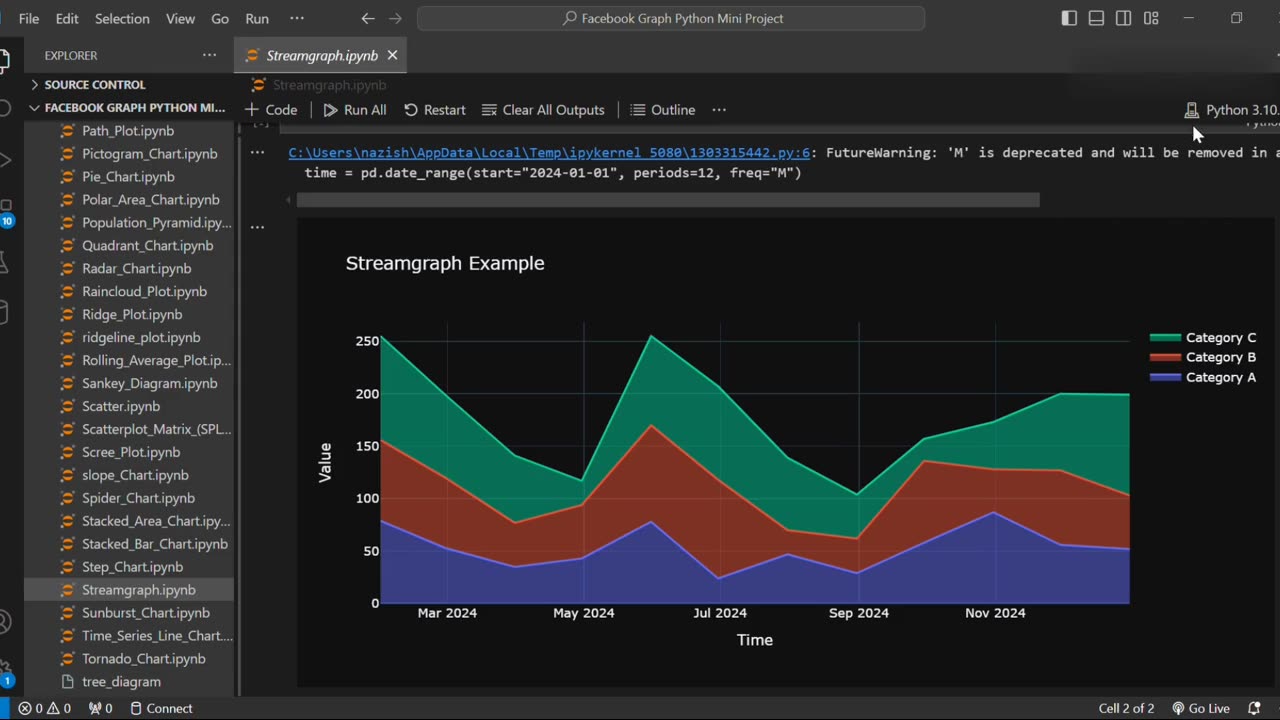
Create Streamgraph Using Python | Data Visualization Tutorial
Want to visualize changes in data over time with a smooth and flowing design? 🌊
In this tutorial, you'll learn how to create stunning Streamgraphs using Python with libraries like Matplotlib and Plotly.
📌 What You’ll Learn:
What a streamgraph is
When and why to use streamgraphs
Step-by-step guide to creating a streamgraph in Python
Customizing colors, labels, and layout for better insights
Perfect for time series and category-based data! 📈
Loading comments...
-
 0:17
0:17
AI Evolutionary Technology
2 months agoVisualizing Molecular Structure From SMILES Using RDKit 🧪
5 -
 7:57
7:57
Blackstone Griddles
1 day agoDouble Barrel Sausage Sandwich | Blackstone Griddles
7031 -
 32:24
32:24
Forrest Galante
10 hours agoHunting and Eating The World's WORST Fish (Everglades At Night)
88.5K4 -
 32:10
32:10
Nikko Ortiz
15 hours agoSecret Agent Infiltrates Neo-Nazis...
9.05K12 -
 15:04
15:04
MetatronGaming
1 day agoOriginal Commodore 64 VS C64 Maxi - Review and Comparison
18.2K7 -
 9:46
9:46
MattMorseTV
13 hours ago $16.18 earnedTrump just SHUT DOWN a $287,000,000 FRAUD RING.
17.9K77 -
 15:48
15:48
GritsGG
15 hours agoWinning a Rare Solos Prison End Game on Warzone!
13.3K1 -
 11:37
11:37
The Pascal Show
15 hours ago $3.68 earnedTHEY WANT TO END HER?! Candace Owens Claims French President & First Lady Put A H*t Out On Her?!
11.7K13 -
 LIVE
LIVE
Lofi Girl
2 years agoSynthwave Radio 🌌 - beats to chill/game to
455 watching -
 24:30
24:30
DeVory Darkins
16 hours agoMarjorie Taylor Greene RESIGNS as Minnesota dealt MAJOR BLOW after fraud scheme exposed
78.7K125