Create Streamgraph Using Python
4 months ago
8
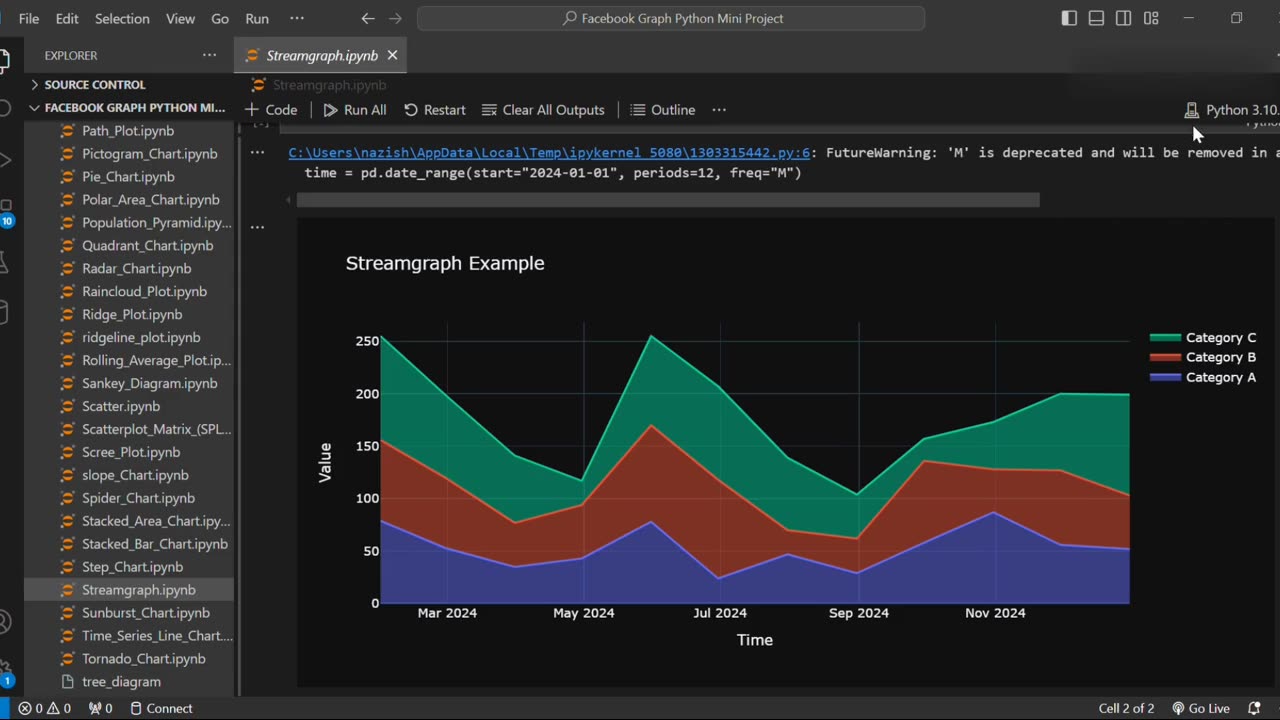
Create Streamgraph Using Python | Data Visualization Tutorial
Want to visualize changes in data over time with a smooth and flowing design? 🌊
In this tutorial, you'll learn how to create stunning Streamgraphs using Python with libraries like Matplotlib and Plotly.
📌 What You’ll Learn:
What a streamgraph is
When and why to use streamgraphs
Step-by-step guide to creating a streamgraph in Python
Customizing colors, labels, and layout for better insights
Perfect for time series and category-based data! 📈
Loading comments...
-
 1:02
1:02
AI Evolutionary Technology
1 month agoLive Weather App in Python | BeautifulSoup & Web Scraping Tutorial
81 -
 LIVE
LIVE
Steven Crowder
3 hours ago🔴Failed Hit Job: Another Trump Media Hoax Exposed
22,424 watching -
 56:36
56:36
The Rubin Report
2 hours agoFox Hosts Stunned by Piers Morgan’s Dark Prediction for NYC Under Zohran Mamdan
13.5K15 -
![GRAY ZONE DEVLOG FOR .3.5 UPDATE!!! [RGMT CONTENT Mgr. | RGMT GL | GZW CL]](https://1a-1791.com/video/fww1/11/s8/1/0/K/B/w/0KBwz.0kob-small-GRAY-ZONE-DEVLOG-FOR-.3.5-U.jpg) LIVE
LIVE
XDDX_HiTower
33 minutes agoGRAY ZONE DEVLOG FOR .3.5 UPDATE!!! [RGMT CONTENT Mgr. | RGMT GL | GZW CL]
51 watching -
 LIVE
LIVE
LFA TV
15 hours agoLIVE & BREAKING NEWS! | TUESDAY 11/4/25
3,979 watching -
 LIVE
LIVE
The Shannon Joy Show
1 hour agoICE Brutality In Evanston, Illinois Sparks New Outrage * GOP Seeks New FISA Re-Authorization * Are Tucker Carlson & Nick Fuentes Feds?
228 watching -
 LIVE
LIVE
The Mel K Show
1 hour agoA Republic if You Can Keep It-Americans Must Choose 11-04-25
537 watching -
 LIVE
LIVE
Grant Stinchfield
1 hour agoThe Mind Meltdown: Are COVID Shots Fueling America’s Cognitive Collapse?
140 watching -
 1:00:46
VINCE
4 hours agoThe Proof Is In The Emails | Episode 161 - 11/04/25
146K115 -
 2:12:22
Benny Johnson
2 hours ago🚨Trump Releases ALL Evidence Against James Comey in Nuclear Legal BOMBSHELL! It's DARK, US in SHOCK
77.7K26