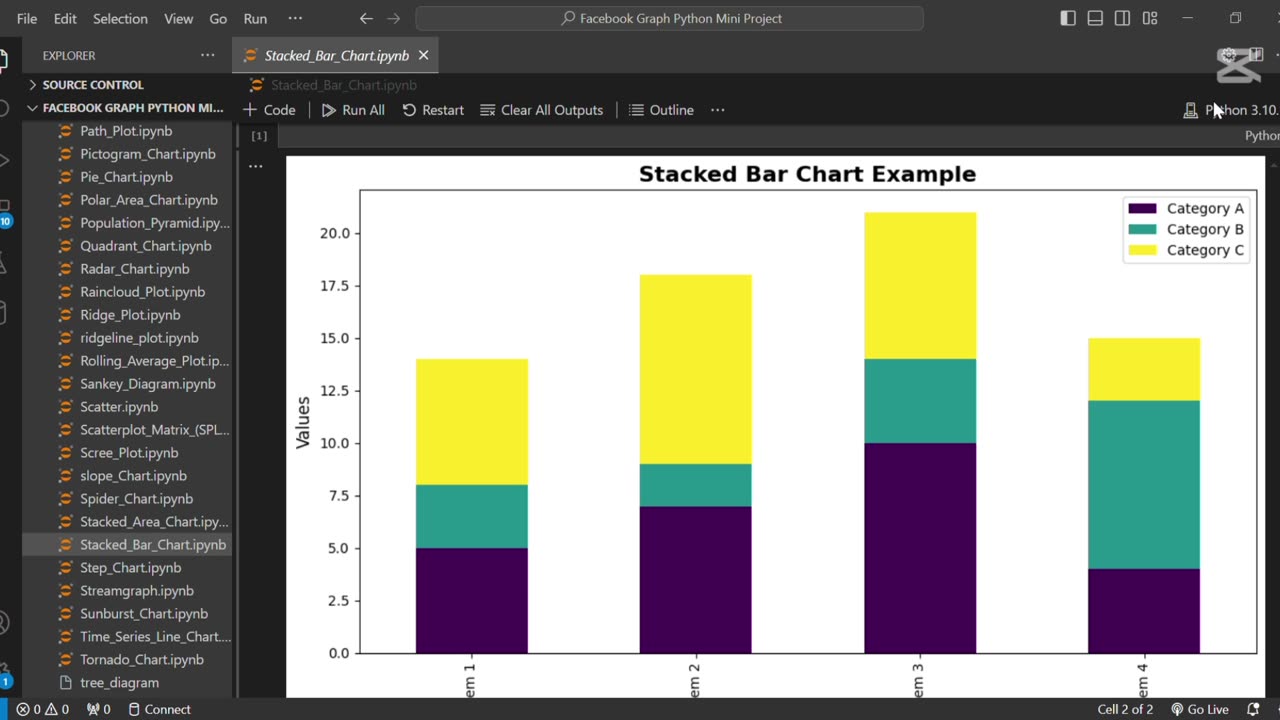
Create stacked bar chart using Python 📊
Loading comments...
-
 0:20
0:20
AI Evolutionary Technology
2 months agoUsing Python to Analyze Your Internet Connection
171 -
 LIVE
LIVE
ShivEmUp
4 hours ago🔴LIVE🔴🔵Battlefield 6🔵Game Changing Updates?🔵Grumpy Bird🔵
54 watching -
 LIVE
LIVE
Grant Cardone
6 hours agoHow to Find Your First $1million Profit In Real Estate
965 watching -
![[ FF7 Remake] | Cloud doing what he does best [ PART 6 ]](https://1a-1791.com/video/fwe2/a6/s8/1/Y/8/Y/F/Y8YFz.0kob.1-small--FF7-Remake-Cloud-doing-wha.jpg) 5:00:59
5:00:59
CHiLi XDD
5 hours ago[ FF7 Remake] | Cloud doing what he does best [ PART 6 ]
144 -
![Mr & Mrs X - [DS] Pushing Division, Traitors Will Be Exposed, Hold The Line - EP 18](https://1a-1791.com/video/fwe2/96/s8/1/w/U/W/F/wUWFz.0kob-small-Mr-and-Mrs-X-DS-Pushing-Div.jpg) 54:40
54:40
X22 Report
8 hours agoMr & Mrs X - [DS] Pushing Division, Traitors Will Be Exposed, Hold The Line - EP 18
118K40 -
 LIVE
LIVE
FusedAegisTV
19 hours agoFUSEDAEGIS | Confronting the Paintress | Expedition 33 PART VIII
29 watching -
 LIVE
LIVE
ReAnimateHer
21 hours ago $1.49 earnedScreams in the Fog | DBD Live
127 watching -
 2:33:21
This is the Ray Gaming
3 hours ago $0.17 earnedNew Shirt SaturRAY | Rumble Premium Creator
8.72K1 -
 LIVE
LIVE
PenguinSteve
2 hours agoLIVE! The Return of the Battlefield 6!
47 watching -
 54:54
54:54
iCkEdMeL
4 hours ago $54.34 earned🔴 BREAKING: Gunman Opens Fire at Tim Pool’s Home
84.7K49