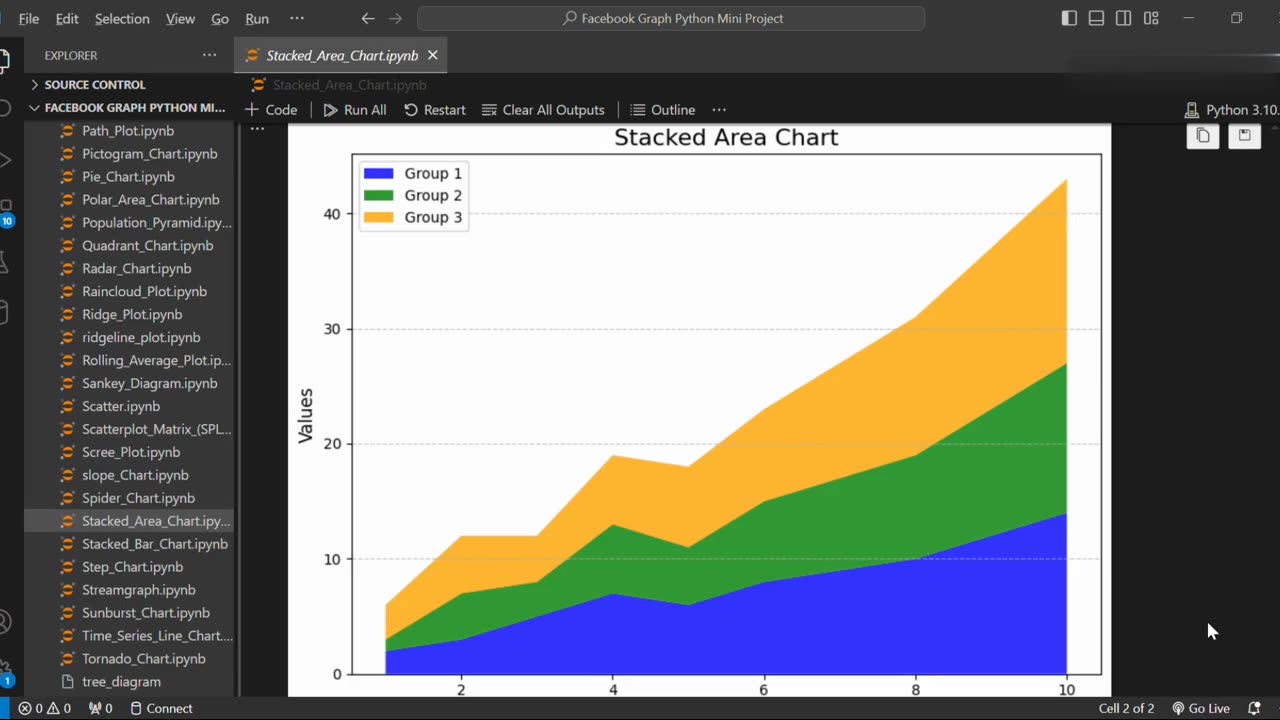
Create Stack Area Chart Using Python
Loading comments...
-
 0:18
0:18
AI Evolutionary Technology
1 month ago💰 Simple Currency Converter App in Python
32 -
 LIVE
LIVE
Lofi Girl
2 years agoSynthwave Radio 🌌 - beats to chill/game to
253 watching -
 24:30
24:30
DeVory Darkins
13 hours agoMarjorie Taylor Greene RESIGNS as Minnesota dealt MAJOR BLOW after fraud scheme exposed
43.2K111 -
 2:19:48
Badlands Media
1 day agoDevolution Power Hour Ep. 409: Panic in the Narrative — Epstein, Israel, and the Manufactured Meltdowns
152K40 -
 1:52:38
Man in America
10 hours agoCommunists VS Zionists & the Collapse of the American Empire w/ Michael Yon
59K25 -
 4:09:34
Akademiks
5 hours agoSheck Wes exposes Fake Industry. Future Not supportin his mans? D4VD had help w disposing his ex?
35.9K3 -
 6:43:43
SpartakusLIVE
9 hours agoTeam BUNGULATORS || From HUGE WZ DUBS to TOXIC ARC BETRAYALS
108K3 -
 2:44:56
BlackDiamondGunsandGear
5 hours agoAre You that guy? / Carrying a Pocket Pistol /After Hours Armory
22.3K -
 DVR
DVR
Camhigby
5 hours agoLIVE - Riot Watch Portland, DC, NC
23.7K20 -
 2:54:58
CAMELOT331
7 hours agoYouTube Just Told Me I OWE THOUSANDS $ TO THEM... update
30.9K5