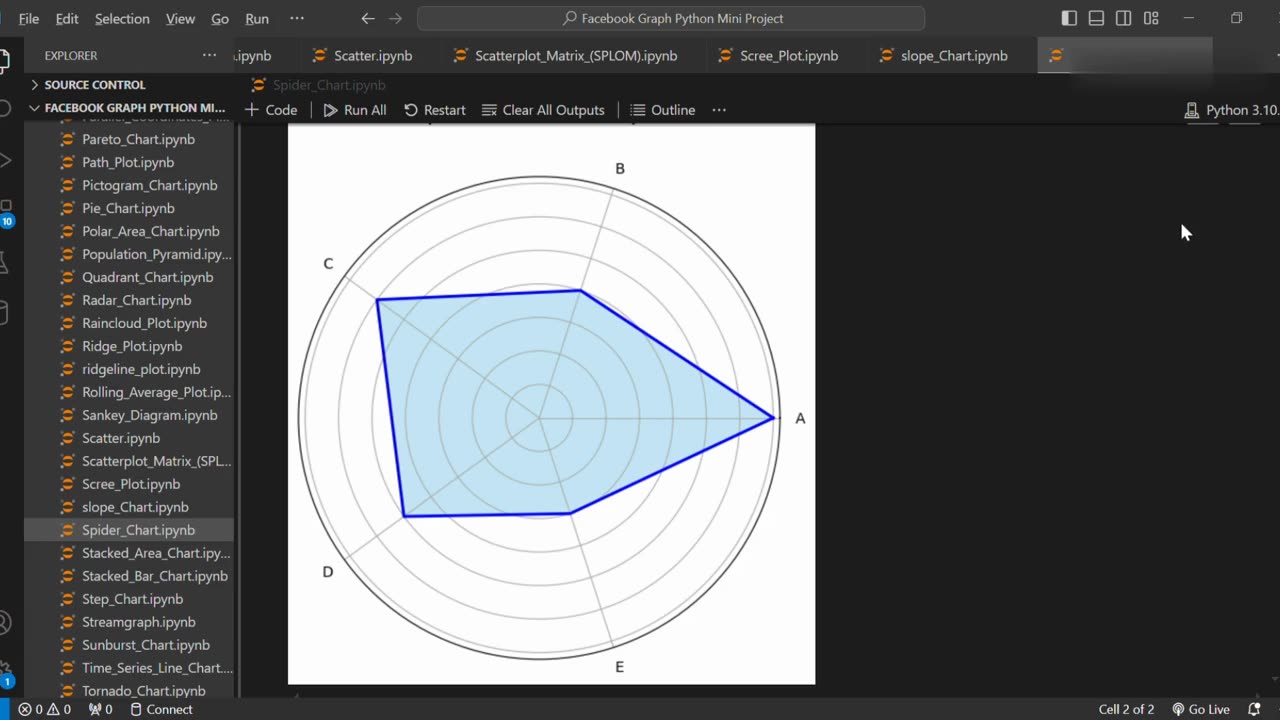
Create Spider Chart Using Python
2 months ago
4
A Spider Chart (also known as a Radar Chart) is a graphical method used to display multivariate data in a way that highlights differences between multiple variables. Using Python libraries like matplotlib, you can easily create customizable spider charts to visualize performance metrics, skill comparisons, or survey data.
Loading 2 comments...
-
 0:52
0:52
AI Evolutionary Technology
1 day ago📦 Ignoring Built-In Functions and Libraries Using Python 🐍
3 -
 14:41
14:41
Nate The Lawyer
1 day ago $0.66 earnedWhy Hasn’t Raja Jackson Been Arrested Yet?
4.04K13 -
 6:04
6:04
Buddy Brown
2 days ago $1.21 earnedEugene’s SICK Newspaper Cover is a WARNING to Us All! | Buddy Brown
6.99K9 -
 16:23
16:23
Actual Justice Warrior
1 day agoMom Sucker Punched By Repeat Offender In Chicago
11K29 -
 56:28
56:28
Professor Nez
1 day ago🚨Not Only is Epstein NOT Going Away… It Just Got Worse!
25K25 -
 8:09
8:09
MattMorseTV
17 hours ago $11.19 earnedTrump scores 17th CONSECUTIVE Supreme Court VICTORY.
76.7K60 -
 2:11:25
Side Scrollers Podcast
19 hours agoUK JAILS TV WRITER FOR WRONG THINK + TWITCH ALLOWS CYBERSTALKING + MORE | SIDE SCROLLERS LIVE
34.9K10 -
 10:47
10:47
Nikko Ortiz
1 day agoThese Tik Tok Clips Are Extremely Painful...
55.3K7 -
 13:43
13:43
GritsGG
15 hours agoI Made a Brand New Warzone Account! Will I Get Bot Lobbies?
12.4K1 -
 1:09:23
The HotSeat
15 hours agoTrump’s Parade = Mocked, China’s Parade = Praised: Leftist Hypocrisy EXPOSED
38.7K33