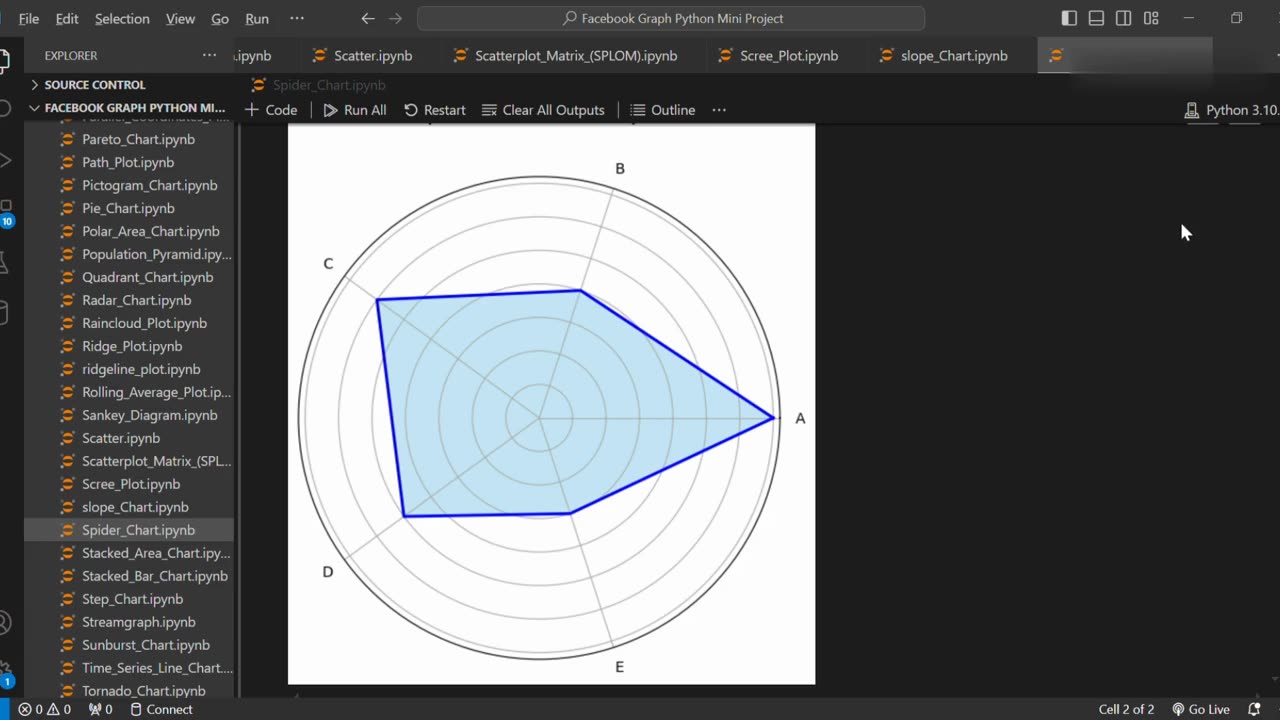
Create Spider Chart Using Python
5 months ago
6
A Spider Chart (also known as a Radar Chart) is a graphical method used to display multivariate data in a way that highlights differences between multiple variables. Using Python libraries like matplotlib, you can easily create customizable spider charts to visualize performance metrics, skill comparisons, or survey data.
Loading 2 comments...
-
 0:16
0:16
AI Evolutionary Technology
1 month agoCreate Email Check Account Services Using Python
9 -
 2:54:58
CAMELOT331
5 hours agoYouTube Just Told Me I OWE THOUSANDS $ TO THEM... update
20.2K2 -
 2:00:53
Tundra Tactical
12 hours ago $0.89 earned🛑LIVE AT 9PM CST!! Your Government Hates Your Guns : DOJ Holds Firm On National FIREARMS ACT
13.3K -
 LIVE
LIVE
DLDAfterDark
3 hours ago $1.16 earnedAre YOU The Guy That Ruins Thanksgiving?? - God Guns & Gear
309 watching -
 2:58:31
NewsTreason
4 hours agoDECLAS w/ Rambo & Dave: Nuremberg 2.0 | MTG Exits Stage Left | Mamdani Psyop Confirmed, 8pm EST
61.8K59 -
 LIVE
LIVE
meleegames
4 hours agoSONG REQUESTS CLOSED - Melee Music - Beat Hazard 3 - Devil Inside
234 watching -
 2:13:31
The Connect: With Johnny Mitchell
11 hours ago $1.62 earnedIs Garth Brooks A Serial Killer? Exposing The Dark Secrets Of Country Music's Biggest Star
10.8K2 -
 1:00:49
MattMorseTV
5 hours ago $79.23 earned🔴Massive VICTORY in the SUPREME COURT.🔴
100K126 -
 LIVE
LIVE
GritsGG
4 hours ago#1 Most Warzone Wins 4015+!
78 watching -
 4:20:08
Biscotti-B23
7 hours ago $1.06 earned🔴 LIVE STREAM ENDS WHEN I GET 100 WINS 🥵 INVINCIBLE VS CLOSED ALPHA
11.4K3